
I was recently contacted by a customer who runs a busy ERP system on their Oracle database. Their users have been screaming for some time about unpredictable performance, where application screens which would usually open in under a second suddenly take an age. ERP systems are legendary for this, of course, because as each screen loads the application tends to fire off a glut of queries to populate all the various fields, graphs and so on. When performance problems strike, the elapsed time for each query rises, which usually results in “stuff going slowly”. And unfortunately, because of something known to psychologists as the availability heuristic, users tend not to remember the times when performance was acceptable… just the occasions when they were left frustrated.
Initial Investigation
The first thing I ask for in situations like this is a set of AWR reports. Customers are generally happy to part with such information, whereas the running of bespoke SQL scripts to harvest data can often cause delays as the scripts have to be investigated and tested. AWR reports, I’m sure you know, contain information about the behaviour and performance of the database between two points in time – and much of the data is averaged. For this reason, I always always ask for a set of multiple, consecutive reports covering the problematic period where each report covers no more than one hour. I’d prefer less than one hour per report, but the default configuration of Oracle results in hourly snapshots so that’s usually the limit… as it was for this customer.
As a first pass, I like to run the AWR reports through my awr-parser.sh script. This parses them all and produces a CSV file as output. This can then be easily used to graph information such the amount of time spent working on CPU versus time spent waiting on I/O requests to complete. Often this is enough to get a basic idea of what’s happening….

In the above graph, each column shows data from a single (hourly) AWR report; blue represents DB CPU while red represents User I/O wait time. If we are looking to increase the user experience with low-latency storage then we would hope to find two things: a) lots of User I/O wait time, and b) average latency which is higher than we would expect a flash array to deliver.
Unfortunately, the first requirement isn’t really there in the above graph. There just isn’t enough red, except for peaks towards the end of the day where there appears to be some batch job or backup taking place. A peak at the AWR reports shows that this is in fact a scheduled job which performs an online rebuild of an index. With more capable storage we could make this go a lot faster, so would that perhaps help the customer?
Sadly, the answer was no, it wouldn’t. The customer specifically stated that it’s the online day where they struggle and not the index rebuild. Hmmm.
More Graphs
Let’s have a look at some of the other information that came out of the AWR reports to see if anything interesting shows up:

Plenty of spare CPU capacity here. In fact, if you think about how much Oracle licenses cost per CPU – and how much CPU is not being used… it looks like this database server represents a significant over-investment.
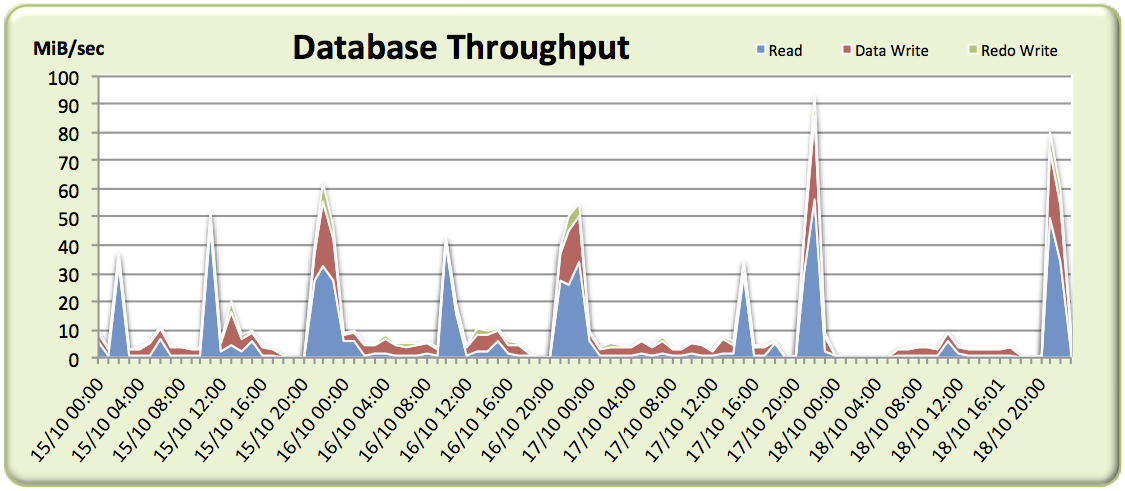
Not much in the way of I/O… there are spikes here and there, including those for the index rebuilds, but overall the I/O rates are very low and for many samples we barely scratch 10MiB/sec.
So what have we got? A system which hardly performs any I/O and doesn’t seem to spend any time waiting on I/O during the period the users are complaining about. Time to go back to the customer and ask for some more detail…
Second Attempt
After a plea for more details, I received another batch of AWR reports covering a single 24 hour period, as well as the crucial information that complaints were received between 5am and 6am. Perfect. Let’s have a look at that throughput graph again:

Again, the throughput is very low – including around the critical 5am-6am period where complaints were received – which might fool us into thinking any problems are not related to the storage. But what about if we plot a graph of I/O Operations Per Second (IOPS)?
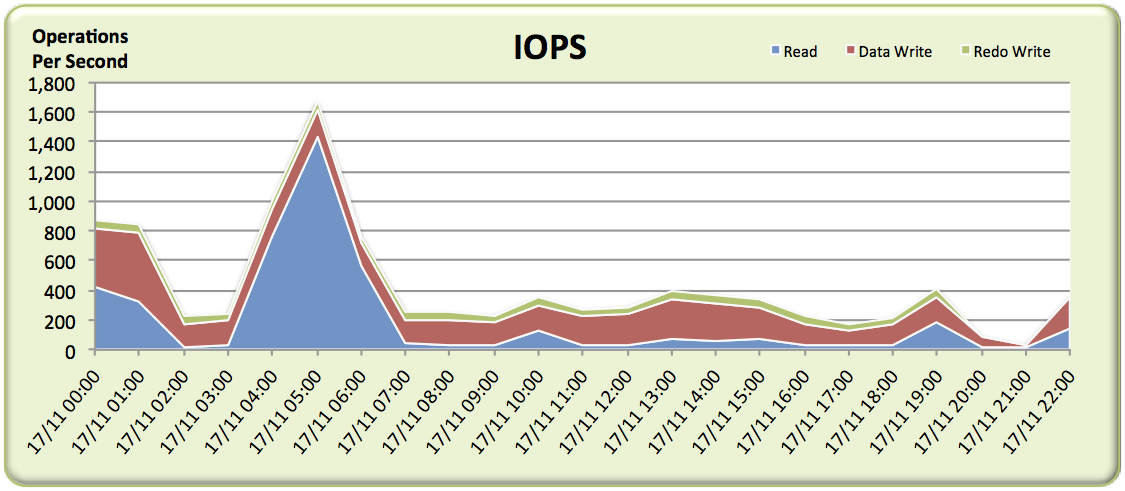
Bingo! There’s a big spike of read IOPS at exactly the time where problems were reported, which we can put down to a large amount of random physical reads. We know from the customer that they have a multi-controller monolithic disk array – the top of the range product from the world’s biggest disk array vendor. But it’s still a disk array, which means random I/O frequently results in high latency as somewhere a disk head has to move across the platter and then the platter has to rotate to the correct sector.
So we should be able to just check the average wait time for random physical reads (the wait event db file sequential read) and it will reveal itself as the problem. Right? We’ll expect to see waits in the region of 4-8ms or perhaps even worse if it’s really struggling.
Here’s a graph of the average user I/O wait time seen across each AWR report – don’t forget we’re especially interested in the troublesome 5am-6am period:
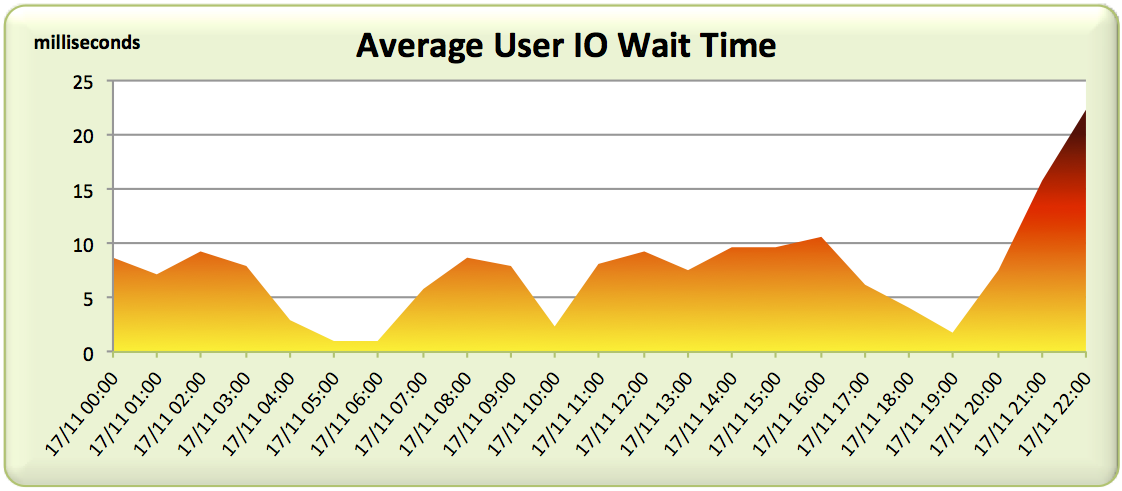
Not what we expected. The 5am-6am slot is showing the best latency figures for the entire day! And this is when users are complaining?
Averages Lie
A disk array like this usually has a reasonably large DRAM cache and quite possibly a set of SSDs being used for further caching or tiering of data. If a physical read can be satisfied from the cache, it will likely be serviced in under a millisecond. But if we experience a cache miss, we’re forced to pay the penalty of mechanical latency and wait for many milliseconds. Thus there are two ranges of response times: sub-millisecond and many milliseconds.
Average wait times won’t show this because they are simply the average of all waits over the period of the AWR report (an entire hour in this case). What if many of the reads are cache hits but some still miss? Maybe it’s possible that there are enough misses to cause users to complain, but enough hits to make the average look acceptable?
Luckily, there is another section in the AWR report which can help here: the Wait Event Histogram. Here’s the histograms covering db file sequential read waits (random physical reads) for our 24 hour period:
$ cat header.txt; for file in `ls -1`; do
grep -A 40 "Wait Event Histogram" $file | grep "db file sequential read" | head -1
done
                                                    % of Waits
                                 -----------------------------------------------
                           Total
Event                      Waits  <1ms  <2ms  <4ms  <8ms <16ms <32ms  <=1s   >1s
-------------------------- ----- ----- ----- ----- ----- ----- ----- ----- -----
db file sequential read     3329  99.2    .8    .0    .0    .0    .0    .0    .0
db file sequential read     3487  99.4    .6    .0    .0
db file sequential read    35.4K  21.0   1.2   2.5  23.2  39.0  11.9   1.1
db file sequential read    82.9K  34.6   1.8   3.4  15.9  31.9  11.2   1.2
db file sequential read    428.6  67.4   2.1   2.5  10.1  15.2   2.4    .3
db file sequential read    4440.  92.6   1.3   1.2   1.9   2.6    .4    .0
db file sequential read    2013K  91.7   1.4   1.2   2.1   3.0    .5    .0
db file sequential read    131.7  45.7   1.1   2.8  15.6  29.1   5.4    .3
db file sequential read    76.3K  20.7   1.7   2.8  21.7  44.0   8.7    .4
db file sequential read    83.7K  31.1   1.1   2.4  16.6  38.1  10.0    .7
db file sequential read    430.4  79.6   1.5   2.0   4.4   9.3   2.9    .3
db file sequential read    106.6  32.3   1.7   3.0  15.4  36.1  10.3   1.2
db file sequential read      94K  23.8   1.8   2.7  16.6  41.7  12.1   1.2
db file sequential read    248.6  36.0   1.8   2.9  14.8  34.5   8.9   1.1
db file sequential read    202.5  31.9   1.4   2.0   9.0  38.0  16.1   1.6
db file sequential read    237.7  20.2   1.9   2.9  17.7  43.5  12.5   1.2
db file sequential read    49.5K   9.4   1.0   2.7  24.1  48.0  13.6   1.1
db file sequential read    75.6K  42.4   1.5   3.0  16.9  29.9   5.9    .5
db file sequential read    88.7K  61.4   1.3   2.5  12.4  18.2   3.8    .4
db file sequential read    644.3  84.3   1.0   1.5   4.3   7.3   1.5    .2
db file sequential read    61.3K  34.9   6.9   4.4  11.0  31.2  10.5   1.1
db file sequential read      330  96.7   3.1    .2    .0    .0
db file sequential read      12K  88.7   9.5   1.2    .4    .2    .1    .0    .0
Now the problem becomes clear. Although many reads are hitting the cache (<1ms bucket), there are an awful lot that are missing. The <2ms and <4ms buckets are virtually empty and then around <8ms we start to see big numbers again. Those are cache misses which incur the penalty of seek time on a hard disk drive somewhere in the array.
What’s more, it’s clear that the array is under some pressure because in many of the AWR reports there are substantial waits in the <16ms and above buckets. I’ve highlighted in red the occasions where over one third of read requests took over 8ms. That’s exactly the sort of behaviour that is making people replace disks with flash.
Let’s visualise the above data. I’ve gone back to the older set of AWR reports and graphed the histogram buckets to see if we can get a feel for the distribution of waits:

As you can see, I’ve tried to go for a heat map-style colour scheme, with green indicating cache hits on the storage array and the colours moving from yellow through orange to red indicating cache misses which result in disk drive seek time. There are also some real outliers in black where requests took over one thousand milliseconds to be serviced (ouch).
Another way to look at it is to make the picture clearer by reducing the detail. In the graph below I’ve simply assumed that everything sub-millisecond is a storage array cache hit and everything else is a miss:

Clearly there are a lot of physical reads paying the price of mechanical latency here.
Conclusion
What this customer does next is up for debate – there are more than just technical issues to consider. But the point of this post is to illustrate that while average wait times are great for getting a rough feel of how a system is behaving, they also offer huge scope to lose details. And sometimes those details are important. The devil, as they say, is truly in the detail…
Update: January 2015 – I have now added the ability to read Wait Event Histograms to my awr-parser.sh script which you can find on my Useful Scripts page…

Thanks, a great blog (as usual). Fluctuations in cache efficiency are indeed a nasty problem. We’re experiencing them fairly often because in addition to the storage cache, we have a major exposure to the OS page cache (lots of memory reserved on production for DR purposes). As a result, the I/O performance becomes almost unpredictable (and to make things worse, OS page cache efficiency appears to be very poorly instrumented in Solaris). I blogged about one of such problems a few months back: http://savvinov.com/2014/08/11/peeling-through-layers-of-cache/
Histograms of single-block read latency (“db file sequential read”) are indeed helpful for understanding what’s going on, although very often their resolution is not sufficient. If it’s possible to trace the process of interest, then of course you can achieve any resolution you like! When I need to visualize data from trace files, there’s a trick I find useful: create an external table on the top of the raw trace file, then use regexp queries to read it in (I have some examples of that in my blog as well, http://savvinov.com/2014/09/08/querying-trace-files/).
But of course in your situation tracing may be tricky because a customer may always be able (or willing) to do that.
Best regards,
Nikolay
Hey Nikolay!
Your method of reading trace files using external tables and regexp is brilliant – I love it!
As you’ve guessed, I have a slight issue in that everything I do must be “light touch”. I no longer work in a professional services role, where getting to the bottom of the issue and finding a resolution are the main aims. In my role in a sales organisation I need to have a lightweight method of determining if our solution (in this case All Flash arrays from Violin Memory) would be beneficial to the customer or not. If I get that wrong then we go through a long sales cycle and eventually the customer may not buy the product, which means I’ve wasted my time and theirs. But equally if I get too involved in the details (or ask for too much information) it’s possible I could put the customer off from dealing with us.
Thanks for commenting Nikolay, I’m a massive fan of your work.
Hey flash,
it’s been a long time since i did not comment on your posts, but i keep reading your blog.
This time i could not resist, your step by step detailed investigation is just pure gem. Apart from the excellent technical stuff, it’s the really perfect example to demonstrate what troubleshooting approach is (An excellent cure for the famous “compulsive troubleshooting disorder :P). It’s really much more than “When Averages Lie” (which is of course perfectly demonstrated).
Your awr-parser.sh script should be owned and used extensively by any serious oracle dba. It’s the missing oracle tool, and it’s not missing anymore, i love it. Thanks you so much for sharing “the precious” ;-).
Hey thanks buddy, I really appreciate your kind words.
Great post ! Just curious ,do you use Excel to graph them or somwethong else ? Thanks
Regards,
Alex
Thanks! Personally I like Excel. I’ve been using it for decades so I can’t make myself find the time to learn something else…
Great post! What was the solution offered?
Thanks. It’s an ongoing opportunity so I can’t predict what will happen, but it wouldn’t be too much of a jump to assume they are looking at replacing their legacy disk arrays with an all flash solution 🙂
Great stuff as always! In my new role I have to interact more with both customers and vendors to evaluate flash arrays for running Oracle. Between you and Kevin I’m trying to learn as much as I can about Oracle database I/O performance and your work is invaluable. Hope we get a chance to meet one of these days.
Thanks Leighton, I appreciate your comments and share your sentiment with regard to meeting up. With regard to your new role, it sounds very interesting – there are a lot of competing flash vendors out there right now, so you will be kept busy trying to work out whose truth makes the most sense. Make sure you get opinions from everyone before forming your own viewpoint. We all believe what we say, but common sense tells me that we can’t all be right!