Understanding Disk: Caching and Tiering


roulette-and-casino

When I was a child, about four or five years old, my dad told me a joke. It wasn’t a very funny joke, but it stuck in my mind because of what happened next. The joke went like this:

Dad: “What’s big at the bottom, small at the top and has ears?”

Me: “I don’t know?”

Dad: “A mountain!”

Me: “Er…<puzzled>…  What about the ears?”

Dad: (Triumphantly) “Haven’t you heard of mountaineers?!”

So as I say, not very funny. But, by a twist of fate, the following week at primary school my teacher happened to say, “Now then children, does anybody know any jokes they’d like to share?”. My hand shot up so fast that I was immediately given the chance to bring the house down with my new comedy routine. “What’s big at the bottom, small at the top and has ears?” I said, with barely repressed glee. “I don’t know”, murmured the teacher and other children expectantly. “A mountain!”, I replied.

Silence. Awkwardness. Tumbleweed. Someone may have said “Duuh!” under their breath. Then the teacher looked faintly annoyed and said, “That’s not really how a joke works…” before waiving away my attempts to explain and moving on to hear someone else’s (successful and funny) joke. Why had it been such a disaster? The joke had worked perfectly on the previous occasion, so why didn’t it work this time?

There are two reasons I tell this story: firstly because, as you can probably tell, I am scarred for life by what happened. And secondly, because it highlights what happens when you assume you can predict the unpredictable.*

Gambling With Performance

So far in this mini-series on Understanding Disk we’ve covered the design of hard drives, their mechanical limitations and some of the compromises that have to be made in order to achieve acceptable performance. The topic of this post is more about bandaids; the sticking plasters that users of disk arrays have to employ to try and cover up their performance problems. Or as my boss likes to call it, lipstick on a pig.

roulette-wheelIf you currently use an enterprise disk array the chances are it has some sort of DRAM cache within the array. Blocks stored in this cache can be read at a much lower latency than those residing only on disk, because the operation avoids paying the price of seek time and rotational latency. If the cache is battery-backed, it can also be used to accelerate writes too. But DRAM caches in storage area networks are notoriously expensive in relation to their size, which is often significantly smaller than the size of the active data set. For this reason, many array vendors allow you to use SSDs as an additional layer of slower (but higher capacity) cache.

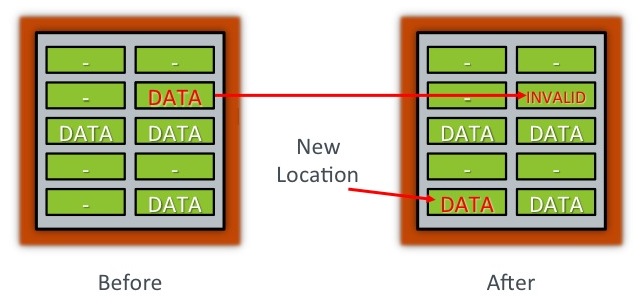
Another common approach to masking the performance of disk arrays is tiering. This is where different layers of performance are identified (e.g. SATA disk, fibre-channel disk, SSD, etc) and data moved about according to its performance needs. Tiering can be performed manually, which requires a lot of management overhead, or automatically by software – perhaps the most well-known example being EMC’s Fully Automated Storage Tiering (or “FAST”) product. Unlike caching, which creates a copy of the data somewhere temporary, tiering involves permanently relocating the persistent location of the data. This relocation has a performance penalty, particularly if data is being moved frequently. Moreover, some automatic tiering solutions can take 24 hours to respond to changes in access patterns – now that’s what I call bad latency.

The Best Predictor of Future Behaviour is Past Behaviour

The problem with automatic tiering is that, just like caching, it relies on past behaviour to predict the future. That principle works well in psychology, but isn’t always as successful in computing. It might be acceptable if your workload is consistent and predictable, but what happens when you run your end of month reporting? What happens when you want to run a large ad-hoc query? What happens when you tell a joke about mountains and expect everyone to ask “but what about the ears”? You end up looking pretty stupid, I can tell you.

las-vegasI have no problem with caching or tiering in principle. After all, every computer system uses cache in multiple places: your CPUs probably have two or three levels of cache, your server is probably stuffed with DRAM and your Oracle database most likely has a large block buffer cache. What’s more, in my day job I have a lot of fun helping customers overcome the performance of nasty old spinning disk arrays using Violin’s Maestro memory services product.

But ultimately, caching and tiering are bandaids. They reduce the probability of horrible disk latency but they cannot eliminate it. And like a gambler on a winning streak, if you become more accustomed to faster access times and put more of your data at risk, the impact when you strike out is felt much more deeply. The more you bet, the more you have to lose.

Shifting the Odds in Your Favour

I have a customer in the finance industry who doesn’t care (within reason) what latency their database sees from storage. All they care about is that their end users see the same consistent and sustained performance. It doesn’t have to be lightning fast, but it must not, ever, feel slower than “normal”. As soon as access times increase, their users’ perception of the system’s performance suffers… and the users abandon them to use rival products.

poker-gameThey considered high-end storage arrays but performance was woefully unpredictable, no matter how much cache and SSD they used. They considered Oracle Exadata but ruled it out because Exadata Flash Cache is still a cache – at some point a cache miss will mean fetching data from horrible, spinning disk. Now they use all flash arrays, because the word “all” means their data is always on flash: no gambling with performance.

Caching and tiering will always have some sort of place in the storage world. But never forget that you cannot always win – at some point (normally the worst possible time) you will need to access data from the slowest media used by your platform. Which is why I like all flash arrays: you have a 100% chance of your data being on flash. If I’m forced to gamble with performance, those are the odds I prefer…

* I know. It’s a tenuous excuse for telling this story, but on the bright side I feel a lot better for sharing it with you.

Oracle SLOB On Solaris

Guest Post

This is another guest post from my buddy Nate Fuzi, who performs the same role as me for Violin but is based in the US instead of EMEA. Nate believes that all English people live in the Dickensian London of the 19th century and speak in Cockney rhyming slang. I hate to disappoint, so have a butcher’s below and feast your mince pies on his attempts to make SLOB work on Solaris without going chicken oriental. Over to you Nate, me old china plate.

slob ghost

Note: The Silly Little Oracle Benchmark, or SLOB, is a Linux-only tool designed and released for the community by Kevin Closson. There are no ports for other operating systems – and Kevin has always advised that the solution for testing on another platform is to use a Linux VM and connect via TNS. The purpose of this post is simply to show what happens when you have no other choice but to try and get SLOB working natively on Solaris…

I wrestled with SLOB 2 for a couple hours last week for a demo build we had in-house to show our capabilities to a prospective customer. I should mention I’ve had great success—and ease!—with SLOB 2 previously. But that was on Linux. This was on Solaris 10—to mimic the setup the customer has in-house. No problem, I thought; there’s some C files to compile, but then there’s just shell scripts to drive the thing. What could go wrong?

Well, it would seem Kevin Closson, the creator of SLOB and SLOB 2, did his development on an OS with a better sense of humor than Solaris. The package unzipped, and the setup.sh script appeared to run successfully, but runit.sh would load up the worker threads and wait several seconds before launching them—and then immediately call it “done” and bail out, having executed on the database only a couple seconds. Huh? I had my slob.conf set to execute for 300 seconds.

I had two databases created: one with 4K blocks and one with 8K blocks. I had a tablespace created for SLOB data called SLOB4K and SLOB8K, respectively. I ran setup.sh SLOB4K 128, and the log file showed no errors. All good, I thought. Now run runit.sh 12, and it stops as quickly as it starts. Oof.

It took Bryan Wood, a much better shell script debugger (hey, I said DEbugger) than myself, to figure out all the problems.

First, there was this interesting line of output from the runit.sh command:

NOTIFY: Connecting users 1 2 3 Usage: mpstat [-aq] [-p | -P processor_set] [interval [count]]
4 5 6 7 8 9 10

Seems Solaris doesn’t like mpstat –P ALL. However it seems that on Solaris 10 the mpstat command shows all processors even without the -P option.

Next, Solaris doesn’t like Kevin’s “sleep .5” command inside runit.sh; it wants whole numbers only. That raises the question in my mind why he felt the need to check for running processes every half second rather than just letting it wait a full second between checks, but fine. Modify the command in the wait_pids() function to sleep for a full second, and that part is happy.

But it still kicks out immediately and kills the OS level monitoring commands, even though there are active SQL*Plus sessions out there. It seems on Solaris the ps –p command to report status on a list of processes requires the list of process IDs to be escaped where Linux does not. IE:

-bash-3.2$ ps -p 1 2 3
usage: ps [ -aAdeflcjLPyZ ] [ -o format ] [ -t termlist ]
        [ -u userlist ] [ -U userlist ] [ -G grouplist ]
        [ -p proclist ] [ -g pgrplist ] [ -s sidlist ] [ -z zonelist ]
  'format' is one or more of:
        user ruser group rgroup uid ruid gid rgid pid ppid pgid sid taskid ctid
        pri opri pcpu pmem vsz rss osz nice class time etime stime zone zoneid
        f s c lwp nlwp psr tty addr wchan fname comm args projid project pset

But with quotes:

-bash-3.2$ ps -p "1 2 3"
   PID TTY         TIME CMD
     1 ?           0:02 init
     2 ?           0:00 pageout
     3 ?          25:03 fsflush

After some messing about, Bryan had the great idea to simply replace the command:

while ( ps -p $pids > /dev/null 2>&1 )

With:

while ( ps -p "$pids" > /dev/null 2>&1 )

Just thought I might save someone else some time and hair pulling by sharing this info… Here are the finished file diffs:

-bash-3.2$ diff runit.sh runit.sh.original
31c30
< while ( ps -p "$pids" > /dev/null 2>&1 )
---
> while ( ps -p $pids > /dev/null 2>&1 )
33c32
<       sleep 1
---
>       sleep .5
219c218
<       ( mpstat 3  > mpstat.out ) &
---
>       ( mpstat -P ALL 3  > mpstat.out ) &

How To Succeed In Presales?

success-and-failure

This article is aimed at anyone considering making the move into technical presales who currently works in a professional services, consultancy or support role, or as customers and end-users. You will notice that the title of the article has a question mark at the end – that’s because I don’t have the answer – and I have neither the confidence nor the evidence to claim that I have been a success. But I have made lots of mistakes… and apparently you can learn from those, so here I will share some of my experiences of making the leap. I’d also like to point out that after two years working in presales for Violin Memory I haven’t – yet – been fired, which I believe is a good sign.

My first day at Violin Memory was a disaster. In fact, let me be more specific, it was my first hour. Having spent my career working variously as in development, as a consultant for an Oracle partner, an Oracle customer and then in professional services for Oracle itself, I’d finally taken the leap into technical presales and this was to be my first day. Sure I’d done bits and pieces of presales work before, but this was a proper out-and-out presales role – and I knew that I was either going to sink or swim. Within the first hour I was deep underwater.

Someone doing a much better job than me

Someone doing a much better job than me

By a quirk of timing, it turned out that my first day at Violin was actually the first day of the annual sales conference held in silicon valley. So the day before I’d boarded a plane with a number of other fresh recruits (all veterans of sales organisations) and flown to San Francisco where, in the true spirit of any Englishman abroad, I’d set about using alcohol as a tool to combat jet lag. Smart move.

It’s not as if I didn’t know what a mistake this was. I’d learnt the same lesson on countless other occasions in my career – that having a hangover is painful, unprofessional and deeply unimpressive to those unfortunate enough to meet you the following morning – but maybe my attempts to integrate with my new team were a little bit over-enthusiastic. Meanwhile, my new boss (the one who had taken the gamble of employing me) had asked me to prepare a presentation which would be delivered to the team at some point on day 1.

Day 1 arrived – and at 8.00am we gathered in a conference room to see the agenda. Guess who was up first? At 8.05am I stood up, hungover, unprepared, very nervous and (give me a break, I’m looking for excuses) jet-lagged to deliver… well if it wasn’t the worst presentation of my life, it was in the top two (I have previously mentioned the other one here). I mumbled, I didn’t look for feedback from the audience, I talked too fast for the non-native English speakers in the room and my content was too technical. I’m surprised they didn’t pack me off to the airport right then. It was not a success.

And Yet…

The thing is, the subject of my talk was databases. As anyone who knows me can attest (to their misfortune), I love talking about databases. It’s a subject I am passionate about and, if you get me started, you may have trouble stopping me. This is because to me, talking about database is just as much fun as actually using them, but much easier and with less need to remember the exact syntax. So why did I choke that day – the worst possible day to make a bad impression?

unpreparedThere is an obvious moral to my tale, which is not to be so stupid. Don’t turn up unprepared, do make sure your content is at the right level and don’t drink too much the night before. Follow those rules and you’ll be confident and enthusiastic instead of nervous and monotonous. But you know this and I didn’t tell this sorry tale just to deliver such a lame piece of advice.

One of the enduring myths about working in sales is that it’s all about delivering presentations – and this sometimes puts people off, since many have little presentation experience nor an easy way of gaining it. While it’s true that being able to present and articulate ideas or solutions is an essential part of any sales role (I wouldn’t recommend presales if you actively dislike presenting), in the last two years I’ve come to the conclusion that there are more important qualities required. In my opinion the single most important skill needed to work in presales is the ability to become a trusted advisor to your (potential) customers. People buy from people they trust. If you want to help sell, you don’t need to impress people with your flair, style or smart suit (not that those things won’t help)… you need to earn their trust. And if you deliver on that trust, not only will they buy from you, they will come back again for more.

If you work (successfully) in professional services or consultancy right now, the chances are you already do this. Your customers won’t value your contribution unless they trust you. Likewise if you work for a customer or end-user, it’s quite likely that you have internal customers (e.g. the “business” that your team supports) and if you’ve gained their trust, you’re already selling something: yourself, your skills and the service you provide.

beerIt’s not for everybody, but I find working in technical presales hugely fulfilling. I get to meet lots of interesting customers, see how they run their I.T. organisations and services, talk to them about existing and future technologies and I get to experience the highs (and lows) of winning (or not winning) deals.

If you’re thinking of making the move, don’t be put off by concerns over a lack of sales experience. You may not be aware, but the chances are, you already have it. Just don’t drink too much the night before your first day…

The Ultimate Guide To Oracle with Advanced Format 4k

fud

It’s a brave thing, calling something the “Ultimate Guide To …” as it can leave you open to criticism that it’s anything but. However, this topic – of how Oracle runs on Advanced Format storage systems and which choices have which consequences – is one I’ve been learning for two years now, so this really is everything I know. And from my desperate searching of the internet, plus discussions with people who are usually much knowledgeable than me, I’ve come to the conclusion that nobody else really understands it.

In fact, you could say that it’s a topic full of confusion – and if you browsed the support notes on My Oracle Support you’d definitely come to that conclusion. Part of that confusion is unfortunately FUD, spread by storage vendors who do not (yet) support Advanced Format and therefore benefit from scaring customers away from it. Be under no illusions, with the likes of Western DigitalHGST and Seagate all signed up to Advanced Format, plus Violin Memory and EMC’s XtremIO both using it, it’s something you should embrace rather than avoid.

However, to try and lessen the opportunity for those competitors to point and say “Look how complicated it is!”, I’ve split my previous knowledge repository into two: a high-level page and an Oracle on 4k deep dive. It’s taken me years to work all this stuff out – and days to write it all down, so I sincerely hope it saves someone else a lot of time and effort…!

Advanced Format with 4k Sectors

Advanced Format: Oracle on 4k Deep Dive

A New Approach To My Blogroll

Like most people, I have a panel on the right hand side of my blog which contains my blogroll, i.e. a list of links to the blogs of other people I respect and admire. And like most people in the Oracle world, up until today it was full of the same names you always see. To pick three examples:

Tanel Poder – One of the most interesting and entertaining Oracle experts around, someone you should definitely see present (and drink beer with)

Jonathan Lewis – Another legendary Oracle guru who literally wrote the book on the subject. If you haven’t read this, you should.

Cary Millsap – One of my favourites, whose articles are always more than just interesting – they are thought-provoking.

So why are these names no longer on my list? It’s not due to a lack of respect on my part, since I admire these guys enormously. It’s just because, well… everyone knows them already. What’s the point of linking to people when everyone already knows them, follows them, reads their stuff and learns from them every day?

So from today, I’m going to adopt a new approach to my blogroll, which is to limit it to just three groups of links:

  • Violin Memory-related links, such as the corporate website and the blogs of my colleagues
  • Storage-industry-related blogs from competitors of Violin who I admire and respect
  • The blogs of less-well-known members of the Oracle community that I think are just as admirable and useful as the legends I mentioned above

If you are one of the names in the last list, please don’t take the phrase “less-well-known” as an insult! Everyone is less-well-known than Tanel, after all. And if you aren’t on the list, well – now you don’t need to feel aggrieved, because it obviously means you are just too popular to make the grade!


New installation cookbook for SUSE Linux Enterprise Server 11 SP3

Exactly what it says on the tin, I’ve added a new installation cookbook for SUSE 11 SP3 which creates Violin on a set of 4k devices.

I’ve started setting the add_random tunable of the noop I/O scheduler because it seems to give a boost in performance during benchmarking runs. If I can find the time, I will blog about this at some point…

For more details read this document from Red Hat.

Postcards from Storageland: Two Years Flash By

calendar

The start of March means I have been working at Violin Memory for exactly two years. This also corresponds to exactly two years of the flashdba blog, so I thought I’d take stock and look at what’s happened since I embarked on my journey into the world of storage. Quite a lot, as it happens…

Flash Is No Longer The Future

The single biggest difference between now and the world of storage I entered two years ago is that flash memory is no longer an unknown. In early 2012 I used to visit customers and talk about one thing: disk. I would tell them about the mechanical limitations of disk, about random versus sequential I/O, about how disk was holding them back. Sure I would discuss flash too – I’d attempt to illustrate the enormous benefits it brings in terms of performance, cost and environmental benefits (power, cooling, real estate etc)… but it was all described in relation to disk. Flash was a future technology and I was attempting to bring it into the present.

Today, we hardly ever talk disk. Everyone knows the limitations of mechanical storage and very few customers ever compare us against disk-based solutions. These days customers are buying flash systems and the only choice they want to make is over which vendor to use.

Violin Memory 2.0

The storage industry is awash with people who use “personal” blogs as a corporate marketing mouthpiece to trumpet their products and trash the competition. I always avoid that, because I think it’s insulting to the reader’s intelligence; the point of blogging is to share knowledge and personal opinion. I also try to avoid talking about corporate topics such as roadmap, financial performance, management changes etc. But if I wrote an article looking back at two years of Violin Memory and didn’t even mention the IPO, all credibility would be gone.

So let me be honest [please note the disclaimer, these are my personal opinions], the Violin Memory journey over the last couple of years has been pretty crazy. We have such a great product – and the flash market is such a great opportunity – that the wave of negative press last year came as a surprise to me. I guess that shows some naivety on my part for forgetting that product and opportunity are only two pieces of the puzzle, but all the same what I read in the news didn’t seem to correspond to what I saw in my day job as we successfully competed for business around Europe. I had customers who had not just improved but transformed their businesses by using Violin. That had to be a good sign, right?

Now here we are in 2014 and, despite some changes, Violin continues to develop as a company under the guidance of an experienced new CEO. I’m still doing what I love, which is travelling around Europe (in the last month alone I’ve been in the UK, France, Switzerland, Turkey and Germany) meeting exciting new customers and competing against the biggest names in storage (see below). In a world where things change all the time, I’m happy to say this is one thing that remains constant.

The Competition

Now for the juicy bit. Part of the reason I was invited to join Violin was to compete against my former employer’s Exadata product – something I have been doing ever since. However, in those heady days of 2011 it also appeared that Fusion IO would be the big competitor in the flash space. Meanwhile, at that time, none of the big boys had flash array products of note. EMC, IBM, NetApp, Cisco, Dell… nothing. The only one who did was HP, who were busy reselling a product called VMA – yes that’s right, the Violin Memory Array – despite having recently paid $2.4b for 3PAR.

Then everything seemed to happen at once. EMC paid an astonishing amount of money for the “pre-product” XtremIO, which took 18 months to achieve general availability. IBM bought the struggling Texas Memory Systems. HP decided to focus on 3PAR over Violin. Cisco surprised everyone by buying Whiptail (including themselves, apparently). And NetApp finally admitted that their strategy of ignoring flash arrays may not have been such a good idea.

That’s the market, but what have I seen? I regularly compete against other flash vendors in the EMEA region – and don’t forget, I only get involved if it’s an Oracle database solution under consideration. The Oracle deals tend to be the largest by size and occupy a space which you could clearly describe as “enterprise class” – I rarely get involved in midrange or small business-sized deals.

The truth is I see the same thing pretty much every time: I compete against EMC and IBM, or I compete against Oracle Exadata. I’ve never seen Fusion IO in a deal – which is not surprising because their cards and our arrays tend to be solutions for different problems. However, I’ve also never – ever – seen Pure Storage in a competitive situation on one of my accounts, nor Nimbus, Nimble, SolidFire, Kaminario or Skyera. I’ve seen Whiptail, HDS and Huawei maybe once each; HP probably a few more times. But when it comes down to the final bake off, it’s EMC, IBM or Exadata. I claim that my experience is representative of the market, but it is real.

Who is the biggest threat? That’s an easy one to answer: it’s always the incumbent storage supplier. No matter how great a solution you have, or how low a price, it’s always easier for a customer to do nothing than to make a change. Inertia is our biggest competitor. Yet at the same time the incumbent has the biggest problem: so much to lose.

And how am I doing in these competitions? Well, that would be telling. But look at it this way – two years on and I’m still trusted to do this.

I wonder what the next two years will bring?

Update (Spring 2014): I’ve finally had my first ever competitive POC against Pure Storage at a customer in Germany. It would be inappropriate for me to say who won. 🙂

More Problems with Oracle’s Support of 4k Devices

This is going to be another one of those posts, a bit like this one, that discuss the use of Oracle’s database product with Advanced Format devices. I wish there weren’t so many of these posts, but it seems that Oracle has a lot of issues with it’s implementation of 4k support.

(Before reading on, if you aren’t sure what I’m talking about here then please have a read of this page…)

In the last post I built a database which used Oracle ASM (and the Linux ASMLib kernel driver) but found that if the database used an SPFILE which was located on a 4k device (within an ASM diskgroup) it didn’t work. Today, I’m going to forego ASM and use a filesystem instead (something I would never do in real life).

Building a 4k Filesystem

Let’s start with a single 4k LUN being presented from my Violin array. I’ve already configured the Linux device mapper multipathing so that it presents itself as a nicely-named device in the /dev/mapper directory:

[oracle@half-server4 ~]$ ls -l /dev/mapper/fs4ktest 
lrwxrwxrwx 1 root root 7 Feb 25 15:53 /dev/mapper/fs4ktest -> ../dm-7
[oracle@half-server4 ~]$ fdisk -l /dev/mapper/fs4ktest

Note: sector size is 4096 (not 512)

Disk /dev/mapper/fs4ktest: 215.8 GB, 215822106624 bytes
255 heads, 63 sectors/track, 3279 cylinders
Units = cylinders of 16065 * 4096 = 65802240 bytes
Sector size (logical/physical): 4096 bytes / 4096 bytes
I/O size (minimum/optimal): 4096 bytes / 524288 bytes

We can see that this is indeed a 4k device, i.e. it has not only a 4096 byte physical blocksize, but a 4096 byte logical blocksize too. The fdisk command has even taken the time to print a special “Note” to ensure we see the sector size is not the usual 512 bytes. The next thing to do is format it with a filesystem so I’m going to use ext4:

[root@half-server4 ~]# mkfs.ext4 /dev/mapper/fs4test 
mke2fs 1.41.12 (17-May-2010)
Filesystem label=
OS type: Linux
Block size=4096 (log=2)
Fragment size=4096 (log=2)
Stride=1 blocks, Stripe width=128 blocks
2097152 inodes, 8388608 blocks
419430 blocks (5.00%) reserved for the super user
First data block=0
Maximum filesystem blocks=4294967296
256 block groups
32768 blocks per group, 32768 fragments per group
8192 inodes per group
Superblock backups stored on blocks: 
	32768, 98304, 163840, 229376, 294912, 819200, 884736, 1605632, 2654208, 
	4096000, 7962624

Writing inode tables: done                            
Creating journal (32768 blocks): done
Writing superblocks and filesystem accounting information: done

Now it needs to be mounted. I’m just going to stick it on a mount point in a new top-level directory called /fstest:

[root@half-server4 ~]# mkdir -p /fstest/fs4ktest
[root@half-server4 ~]# chown -R oracle:oinstall /fstest
[root@half-server4 ~]# mount /dev/mapper/fs4ktest /fstest/fs4ktest

Finally, we I am going to create an Oracle database using this filesystem. I’m not going to cut and paste all the output for that, because it’s all a bit dull… so let’s just skip to the bit where DBCA has completed and the database is open.

Oracle On A 4k Filesystem

So the good news is, it worked. The database is up and running and the datafiles are located on the 4k filesystem:

[oracle@half-server4 fstest]$ sqlplus / as sysdba

SQL*Plus: Release 12.1.0.1.0 Production on Mon Mar 3 21:30:02 2014
Copyright (c) 1982, 2013, Oracle.  All rights reserved.

Connected to:
Oracle Database 12c Enterprise Edition Release 12.1.0.1.0 - 64bit Production
With the Partitioning, OLAP, Advanced Analytics and Real Application Testing options

SQL> select name from v$datafile;

NAME
---------------------------------------------------------------------------------------
/fstest/fs4ktest/oracle/oradata/FSTEST/datafile/o1_mf_system_9k9wxmw6_.dbf
/fstest/fs4ktest/oracle/oradata/FSTEST/datafile/o1_mf_sysaux_9k9ww6r6_.dbf
/fstest/fs4ktest/oracle/oradata/FSTEST/datafile/o1_mf_undotbs1_9k9wz257_.dbf
/fstest/fs4ktest/oracle/oradata/FSTEST/datafile/o1_mf_users_9k9wz123_.dbf

Cool. We can end this post here then, right? Well, no… because there is a bit of a problem with this database. Let’s just have a quick check of the FILESYSTEMIO_OPTIONS parameter:

SQL> show parameter filesystem

NAME				     TYPE	 VALUE
------------------------------------ ----------- ------------------------------
filesystemio_options		     string	 none

This parameter controls the way that I/O is performed for files located on filesystems. It isn’t relevant for databases using Oracle ASM (for which the DISK_ASYNCH_IO parameter exists instead), but here it’s making a massive difference. According to the Oracle documentation, it has four possible options:

  • ASYNCH: enable asynchronous I/O on file system files, which has no timing requirement for transmission.
  • DIRECTIO: enable direct I/O on file system files, which bypasses the buffer cache.
  • SETALL: enable both asynchronous and direct I/O on file system files.
  • NONE: disable both asynchronous and direct I/O on file system files.

Normally, when I see filesystem-based databases, I find this parameter set to SETALL. This means asynchronous and direct I/O, but here it is set to NONE which means neither. And it’s the DIRECTIO that we are interested in.

One Buffer Cache Is Enough

As you are no doubt aware, Oracle databases have a buffer cache which is used to cache copies of database blocks. However, the Linux operating system also has its own buffer cache for filesystems. Most people would consider it ineffective to use two levels of cache – and if that is the case, it will obviously be the Oracle buffer cache that needs to be used. So let’s set the parameter to use direct I/O and then restart the database (as the parameter is not dynamic):

SQL> alter system set filesystemio_options='directIO' scope=spfile;

System altered.

SQL> shutdown immediate
Database closed.
Database dismounted.
ORACLE instance shut down.
SQL> startup
ORACLE instance started.

Total System Global Area 1.3896E+10 bytes
Fixed Size		    4663568 bytes
Variable Size		 2751465200 bytes
Database Buffers	 1.1107E+10 bytes
Redo Buffers		   33673216 bytes
ORA-00205: error in identifying control file, check alert log for more info

Oh dear. What happened?

[oracle@half-server4 ~]$ tail /u01/app/oracle/diag/rdbms/fstest/fstest/trace/alert_fstest.log 
ORA-00210: cannot open the specified control file
ORA-00202: control file: '/fstest/fs4ktest/oracle/oradata/FSTEST/controlfile/o1_mf_9k9wzp31_.ctl'
ORA-27047: unable to read the header block of file
Linux-x86_64 Error: 22: Invalid argument
Additional information: 1
ORA-205 signalled during: ALTER DATABASE   MOUNT...

The answer, which you can find in My Oracle Support note 1133713.1, is that Oracle does not support 4k devices with direct I/O. This has been the case for a long time – I remember first discovering this nearly two years ago, on 11.2.0.2, yet there is no sign of it being fixed. According to the note, “It is not yet known in which version this support will be available.” Pah.

There’s More: Diagnostic Destination on 4k

And then there’s the diagnostic destination. How about if I choose to locate this on a 4k filesystem?

SQL> show parameter diagnostic_dest

NAME				     TYPE	 VALUE
------------------------------------ ----------- ------------------------------
diagnostic_dest 		     string	 /u01/app/oracle

SQL> alter system set diagnostic_dest='/fstest/fs4ktest/oracle' scope=spfile;

System altered.

I’ll give it a few minutes and then go and look in some of the files… guess what I see?

ORA-48101: error encountered when attempting to read a file [block] [/fstest/fs4ktest/oracle/diag/rdbms/fstest/fstest/metadata/INCIDENT.ams] [0]
ORA-27072: File I/O error
Linux-x86_64 Error: 22: Invalid argument
Additional information: 4
Additional information: 1
Additional information: -1

Look familiar? (This is nothing to do with direct I/O by the way, I disabled that again before this test.)

So let’s be honest, things aren’t going all that well here. There are still a lot of things that do not appear to work properly when using 4k devices. Luckily, my Violin array can present storage as 512 byte to avoid this sort of issue, but really I feel that Oracle needs to get cracking on its Advanced Format support. This is not just a flash memory thing, pretty much every major disk vendor is making Advanced Format devices now from Western Digital, through HGST to Seagate.

Time to get with the programme?

Oracle ASMLib: Physical and Logical Blocksize

This article is about the use of Advanced Format devices on Oracle’s ASMLib kernel library for Linux. For background, read this page on 4k sector sizes first, otherwise it might all sound like nonsense. Mind you, it mind sound like nonsense anyway, I can’t guarantee anything here. By the way, a big hello to my buddy Nate who asked for this information: you rock, dude.

In more recent versions of ASMLib, Oracle introduced a new parameter into the /etc/sysconfig/oracleasm file:

[root@half-server4 mapper]# tail -5 /etc/sysconfig/oracleasm
# ORACLEASM_USE_LOGICAL_BLOCK_SIZE: 'true' means use the logical block size
# reported by the underlying disk instead of the physical. The default
# is 'false'
ORACLEASM_USE_LOGICAL_BLOCK_SIZE=false

To understand what this parameter does, consider this device which I am presenting from a Violin array:

[root@half-server4 ~]# ls -l /dev/mapper/testlun
lrwxrwxrwx 1 root root 8 Feb 27 15:33 /dev/mapper/testlun -> ../dm-19
[root@half-server4 ~]# fdisk -l /dev/mapper/testlun

Disk /dev/mapper/testlun: 34.4 GB, 34359738368 bytes
255 heads, 63 sectors/track, 4177 cylinders
Units = cylinders of 16065 * 512 = 8225280 bytes
Sector size (logical/physical): 512 bytes / 4096 bytes
I/O size (minimum/optimal): 4096 bytes / 524288 bytes

The important bit there is highlighted in red. This device has a 4k physical blocksize (as all Violin devices do, as well as many other modern storage systems) but has a 512 byte logical blocksize. Essentially, this LUN is pretending to be a 512 byte based.

Now that’s all well and good. Operating systems and applications that cannot support 4k block sizes (e.g. Red Hat 5 and Oracle Linux 5) will happily use this, because they believe it to be 512 byte. But later versions of ASMLib have started being too clever for their own good.

Don’t Look Behind The Curtain

Let’s create an ASMLib label on this device:

root@half-server4 ~]# oracleasm createdisk TESTLUN /dev/mapper/testlun 
Writing disk header: done
Instantiating disk: done

And now we can attempt to put an ASM diskgroup on it:

SQL> CREATE DISKGROUP TEST EXTERNAL REDUNDANCY
DISK 'ORCL:TESTLUN'
ATTRIBUTE
     'sector_size'='512',
     'compatible.asm' = '11.2',
     'compatible.rdbms' = '11.2';  
CREATE DISKGROUP TEST EXTERNAL REDUNDANCY
*
ERROR at line 1:
ORA-15018: diskgroup cannot be created
ORA-15038: disk '' mismatch on 'Sector Size' with target disk group [4096]
[512]

What happened? Well, ASMLib has looked behind the smoke and mirrors and decided that this is actually a 4k device. It’s therefore presenting this to Oracle ASM as 4k, which causes the problem (because I explicitly asked for sector size to be 512 byte on this diskgroup).

One possible solution is to change the ASM_DISKSTRING from it’s default value of NULL (meaning ‘ORCL:*’) to ‘/dev/oracleasm/disks/*’, i.e. the location where ASMLib creates its own block devices. We can test this theory with fdisk:

[oracle@half-server4 ~]$ ls -l /dev/oracleasm/disks/TESTLUN 
brw-rw---- 1 oracle dba 252, 19 Feb 27 15:38 /dev/oracleasm/disks/TESTLUN
[oracle@half-server4 ~]$ fdisk -l /dev/oracleasm/disks/TESTLUN | grep "Sector size"
Sector size (logical/physical): 512 bytes / 4096 bytes

So that would work. But it would lose many of the claimed benefits of ASMLib such as reduced file descriptors and context switching. Also, it feels like a hack.

Setting ORACLEASM_USE_LOGICAL_BLOCK_SIZE

The answer, as you probably guessed, is to set this new parameter. It defaults, wrongly in my opinion, to using the physical block size. We can either edit the value in the file to be true in order to use the logical blocksize, or preferably use the oracleasm configure command:

root@half-server4 ~]# oracleasm configure -b
Writing Oracle ASM library driver configuration: done
[root@half-server4 ~]# oracleasm configure | grep ORACLEASM_USE_LOGICAL_BLOCK_SIZE
ORACLEASM_USE_LOGICAL_BLOCK_SIZE="true"

It can be set back to using the physical blocksize with the following command:

[root@half-server4 ~]# oracleasm configure -p
Writing Oracle ASM library driver configuration: done
[root@half-server4 ~]# oracleasm configure | grep ORACLEASM_USE_LOGICAL_BLOCK_SIZE
ORACLEASM_USE_LOGICAL_BLOCK_SIZE="false"

Finally, a word of warning. If you are like me, then you are a bit stupid and can’t follow instructions properly. I set the value of the parameter to TRUE in upper case and then spent hours wondering why it didn’t work. The answer, to my embarrassment, is that it’s case sensitive. TRUE is not a valid value so it defaults to false. Doh.

Oracle AWR Reports: Understanding I/O Statistics

truth

One consequence of my job is that I spend a lot of time looking at Oracle Automatic Workload Repository reports, specifically at information about I/O. I really do mean a lot of time (honestly, I’m not kidding, I have had dreams about AWR reports). One thing that comes up very frequently is the confusion relating to how the measurements of IOPS and throughput are displayed in the AWR report Load Profile section. The answer, is that they aren’t. Well, not exactly… let me explain.

Physical Read and Write I/O

Right at the top of an AWR report, just after the Database and Host details, you’ll find the familiar Load Profile section. Until recently, it had changed very little through the releases of Oracle since its introduction in 10g. Here’s a sample from 11g Release 2:

Load Profile              Per Second    Per Transaction   Per Exec   Per Call
~~~~~~~~~~~~         ---------------    --------------- ---------- ----------
      DB Time(s):               44.1                0.4       0.07       1.56
       DB CPU(s):                1.6                0.0       0.00       0.06
       Redo size:      154,034,644.3        1,544,561.0
    Logical read:          154,436.1            1,548.6
   Block changes:           82,491.9              827.2
  Physical reads:              150.6                1.5
 Physical writes:           18,135.2              181.9
      User calls:               28.3                0.3
          Parses:              142.7                1.4
     Hard parses:                7.5                0.1
W/A MB processed:                2.1                0.0
          Logons:                0.1                0.0
        Executes:              607.7                6.1
       Rollbacks:                0.0                0.0
    Transactions:               99.7

In my role I have to look at the amount of I/O being driven by a database, so I can size a solution based on flash memory. This means knowing two specific metrics: the number of I/Os per second (IOPS) and the throughput (typically measured in MB/sec). I need to know these values for both read and write I/O so that I can understand the ratio. I also want to understand things like the amount of random versus sequential I/O, but that’s beyond the scope of this post.

The first thing to understand is that none of this information is shown above. There are values for Physical reads and Physical writes but these are actually measured in database blocks. Even if we knew the block size (which we don’t because Oracle databases can have multiple block sizes) we do not know how many I/Os were required. Ten Oracle blocks could be written in one sequential I/O or ten individual “random” I/Os, completely changing the IOPS measurement. To find any of this information we have to descend into the depths of the AWR report to find the Instance Activity Stats section.

In Oracle 12c, the format of the AWR report changed, especially the AWR Load Profile section, which was modified to show the units that each measurement uses. It also includes some new lines such as Read/Write IO Requests and Read/Write IO. Here’s a sample from a 12c database (taken during a 30 second run of SLOB):

Load Profile                    Per Second   Per Transaction  Per Exec  Per Call
~~~~~~~~~~~~~~~            ---------------   --------------- --------- ---------
             DB Time(s):              44.1               0.4      0.07      1.56
              DB CPU(s):               1.6               0.0      0.00      0.06
      Redo size (bytes):     154,034,644.3       1,544,561.0
  Logical read (blocks):         154,436.1           1,548.6
          Block changes:          82,491.9             827.2
 Physical read (blocks):             150.6               1.5
Physical write (blocks):          18,135.2             181.9
       Read IO requests:             150.3               1.5
      Write IO requests:          15,096.9             151.4
           Read IO (MB):               1.2               0.0
          Write IO (MB):             141.7               1.4
             User calls:              28.3               0.3
           Parses (SQL):             142.7               1.4
      Hard parses (SQL):               7.5               0.1
     SQL Work Area (MB):               2.1               0.0
                 Logons:               0.1               0.0
         Executes (SQL):             607.7               6.1
              Rollbacks:               0.0               0.0
           Transactions:              99.7

Now, you might be forgiven for thinking that the values highlighted in red and blue above tell me the very IOPS and throughput information I need. If this were the case, we could say that this system performed 150 physical read IOPS and 15k write IOPS, with throughput of 1.2 MB/sec reads and 141.7 MB/sec writes. Right?

But that isn’t the case – and to understand why, we need to page down five thousand times through the increasingly-verbose AWR report until we eventually find the Other Instance Activity Stats section (or just Instance Activity Stats in pre-12c reports) and see this information (edited for brevity):

Other Instance Activity Stats                  DB/Inst: ORCL/orcl  Snaps: 7-8
-> Ordered by statistic name

Statistic                                     Total     per Second     per Trans
-------------------------------- ------------------ -------------- -------------
physical read IO requests                     5,123          150.3           1.5
physical read bytes                      42,049,536    1,233,739.3      12,371.2
physical read total IO requests              37,162        1,090.3          10.9
physical read total bytes            23,001,900,544  674,878,987.9   6,767,255.2
physical read total multi block              21,741          637.9           6.4
....
physical write IO requests                  514,547       15,096.9         151.4
physical write bytes                  5,063,483,392  148,563,312.9   1,489,698.0
physical write total IO requests            537,251       15,763.0         158.1
physical write total bytes           18,251,309,056  535,495,967.4   5,369,611.4
physical write total multi block             18,152          532.6           5.3

The numbers in red and blue match up with those above, albeit with the throughput values using different units of bytes/sec instead of MB/sec. But the problem is, these aren’t the “total” values – which are highlighted in green. So what are those total values showing us?

Over to the Oracle Database 12c Reference Guide:

physical read IO requests:  Number of read requests for application activity (mainly buffer cache and direct load operation) which read one or more database blocks per request. This is a subset of “physical read total IO requests” statistic.

physical read total IO requests: Number of read requests which read one or more database blocks for all instance activity including application, backup and recovery, and other utilities. The difference between this value and “physical read total multi block requests” gives the total number of single block read requests.

The values that don’t have the word total in them, i.e. the values shown in the AWR Profile section at the start of a report, are only showing what Oracle describes as “application activity“. That’s all very well, but it’s meaningless if you want to know how much your database is driving your storage. This is why the values with total in the name are the ones you should consider. And in the case of my sample report above, there is a massive discrepancy between the two: for example, the read throughput value for application activity is just 1.2 MB/sec while the total value is actually 644 MB/sec – over 500x higher! That extra non-application activity is definitely worth knowing about. (In fact, I was running a highly parallelised RMAN backup during the test just to make the point…)

[Note: There was another section here detailing how to find and include the I/O generated by redo into the totals, but after consultation with guru and legend Tanel Poder it’s come to my attention that this is incorrect. In fact, reads and writes to redo logs are included in the physical read/write total statistics…]

Oracle 12c IO Profile Section

Luckily, Oracle 12c now has a new section which presents all the information in one table. Here’s a sample extracted from the same report as above:

IO Profile                  Read+Write/Second     Read/Second    Write/Second
~~~~~~~~~~                  ----------------- --------------- ---------------
            Total Requests:          16,853.4         1,090.3        15,763.0
         Database Requests:          15,247.2           150.3        15,096.9
        Optimized Requests:               0.1             0.0             0.0
             Redo Requests:             517.5             1.2           516.3
                Total (MB):           1,154.3           643.6           510.7
             Database (MB):             142.9             1.2           141.7
      Optimized Total (MB):               0.0             0.0             0.0
                 Redo (MB):             295.7             0.0           295.7
         Database (blocks):          18,285.8           150.6        18,135.2
 Via Buffer Cache (blocks):          18,282.1           150.0        18,132.0
           Direct (blocks):               3.7             0.6             3.1

Suddenly life is more simple. You want to know the total IOPS and throughput? It’s all in one place. You want to calculate the ratio of reads to writes? Just compare the read and write columns. Happy days.

One word of warning though: there are other database processes driving I/O which may not be tracked in these statistics. I see no evidence for control file reads and writes being shown, although these are insignificant in magnitude. More significant would be I/O from the archiver process for databases running in archive log mode, as each redo log must be sequentially read and re-written out as an archive log. Are these included? Yet another possibility would be the Recovery Writer (RVWR) process which is responsible for writing flashback logs when database flashback logging is enabled. [Discussions with Jonathan Lewis suggest these stats are all included – and let’s face it, he wrote the book on the subject…!]  It all adds up… Oracle really needs to provide better clarity on what these statistics are measuring.

Conclusion

If you want to know how much I/O is being driven by your database, do not use the information in the Load Profile section of an AWR report. Use the I/O Profile section if available, or otherwise skip to the Instance Activity Stats section and look at the total values for physical reads and writes (and redo). Everything else is just lies, damned lies and (I/O) statistics.