 I’ve posted a new installation cookbook for using Oracle within a virtual machine running on Oracle VM. Surprisingly, I was unable to come up with a satisfactory method of accessing external storage that did not involve the use of Oracle ASMLib…
Tag: database
Oracle AWR Reports: When Averages Lie

I was recently contacted by a customer who runs a busy ERP system on their Oracle database. Their users have been screaming for some time about unpredictable performance, where application screens which would usually open in under a second suddenly take an age. ERP systems are legendary for this, of course, because as each screen loads the application tends to fire off a glut of queries to populate all the various fields, graphs and so on. When performance problems strike, the elapsed time for each query rises, which usually results in “stuff going slowly”. And unfortunately, because of something known to psychologists as the availability heuristic, users tend not to remember the times when performance was acceptable… just the occasions when they were left frustrated.
Initial Investigation
The first thing I ask for in situations like this is a set of AWR reports. Customers are generally happy to part with such information, whereas the running of bespoke SQL scripts to harvest data can often cause delays as the scripts have to be investigated and tested. AWR reports, I’m sure you know, contain information about the behaviour and performance of the database between two points in time – and much of the data is averaged. For this reason, I always always ask for a set of multiple, consecutive reports covering the problematic period where each report covers no more than one hour. I’d prefer less than one hour per report, but the default configuration of Oracle results in hourly snapshots so that’s usually the limit… as it was for this customer.
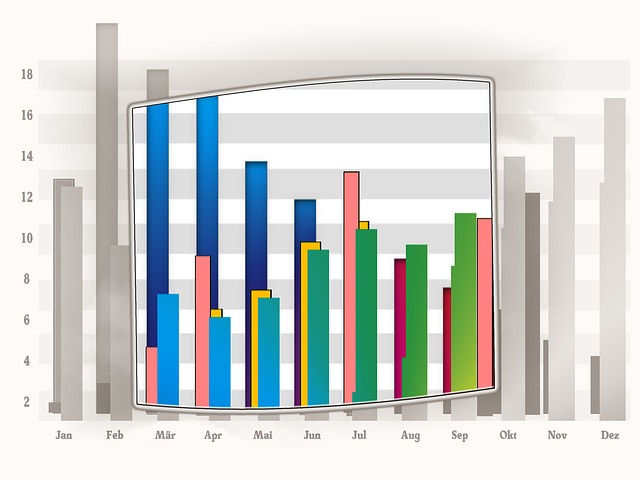
As a first pass, I like to run the AWR reports through my awr-parser.sh script. This parses them all and produces a CSV file as output. This can then be easily used to graph information such the amount of time spent working on CPU versus time spent waiting on I/O requests to complete. Often this is enough to get a basic idea of what’s happening….

In the above graph, each column shows data from a single (hourly) AWR report; blue represents DB CPU while red represents User I/O wait time. If we are looking to increase the user experience with low-latency storage then we would hope to find two things: a) lots of User I/O wait time, and b) average latency which is higher than we would expect a flash array to deliver.
Unfortunately, the first requirement isn’t really there in the above graph. There just isn’t enough red, except for peaks towards the end of the day where there appears to be some batch job or backup taking place. A peak at the AWR reports shows that this is in fact a scheduled job which performs an online rebuild of an index. With more capable storage we could make this go a lot faster, so would that perhaps help the customer?
Sadly, the answer was no, it wouldn’t. The customer specifically stated that it’s the online day where they struggle and not the index rebuild. Hmmm.
More Graphs
Let’s have a look at some of the other information that came out of the AWR reports to see if anything interesting shows up:

Plenty of spare CPU capacity here. In fact, if you think about how much Oracle licenses cost per CPU – and how much CPU is not being used… it looks like this database server represents a significant over-investment.
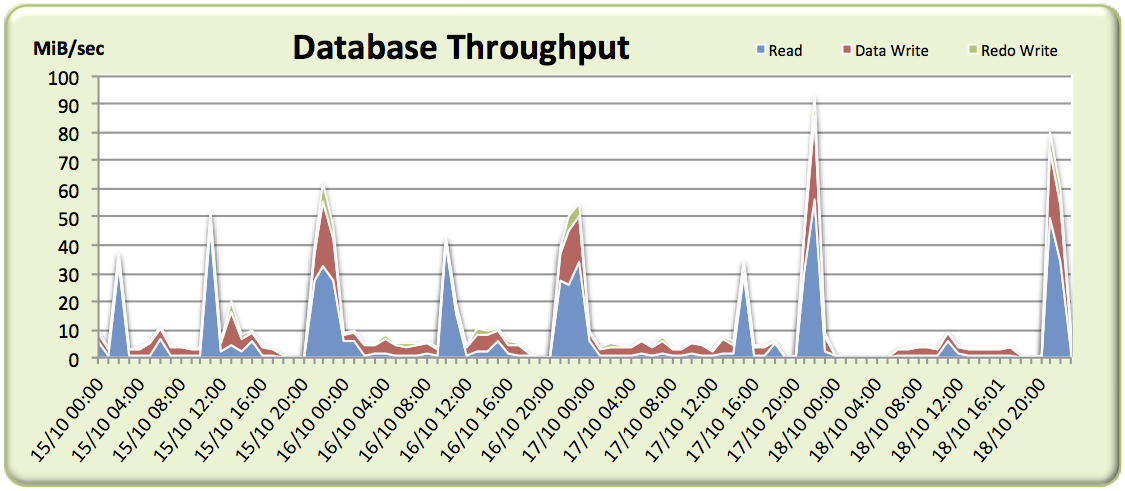
Not much in the way of I/O… there are spikes here and there, including those for the index rebuilds, but overall the I/O rates are very low and for many samples we barely scratch 10MiB/sec.
So what have we got? A system which hardly performs any I/O and doesn’t seem to spend any time waiting on I/O during the period the users are complaining about. Time to go back to the customer and ask for some more detail…
Second Attempt
After a plea for more details, I received another batch of AWR reports covering a single 24 hour period, as well as the crucial information that complaints were received between 5am and 6am. Perfect. Let’s have a look at that throughput graph again:

Again, the throughput is very low – including around the critical 5am-6am period where complaints were received – which might fool us into thinking any problems are not related to the storage. But what about if we plot a graph of I/O Operations Per Second (IOPS)?
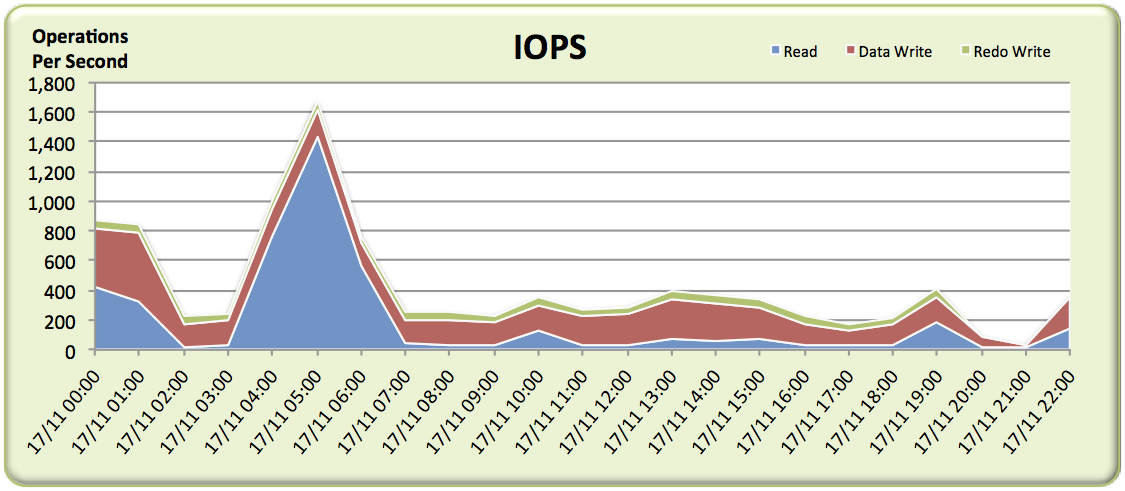
Bingo! There’s a big spike of read IOPS at exactly the time where problems were reported, which we can put down to a large amount of random physical reads. We know from the customer that they have a multi-controller monolithic disk array – the top of the range product from the world’s biggest disk array vendor. But it’s still a disk array, which means random I/O frequently results in high latency as somewhere a disk head has to move across the platter and then the platter has to rotate to the correct sector.
So we should be able to just check the average wait time for random physical reads (the wait event db file sequential read) and it will reveal itself as the problem. Right? We’ll expect to see waits in the region of 4-8ms or perhaps even worse if it’s really struggling.
Here’s a graph of the average user I/O wait time seen across each AWR report – don’t forget we’re especially interested in the troublesome 5am-6am period:
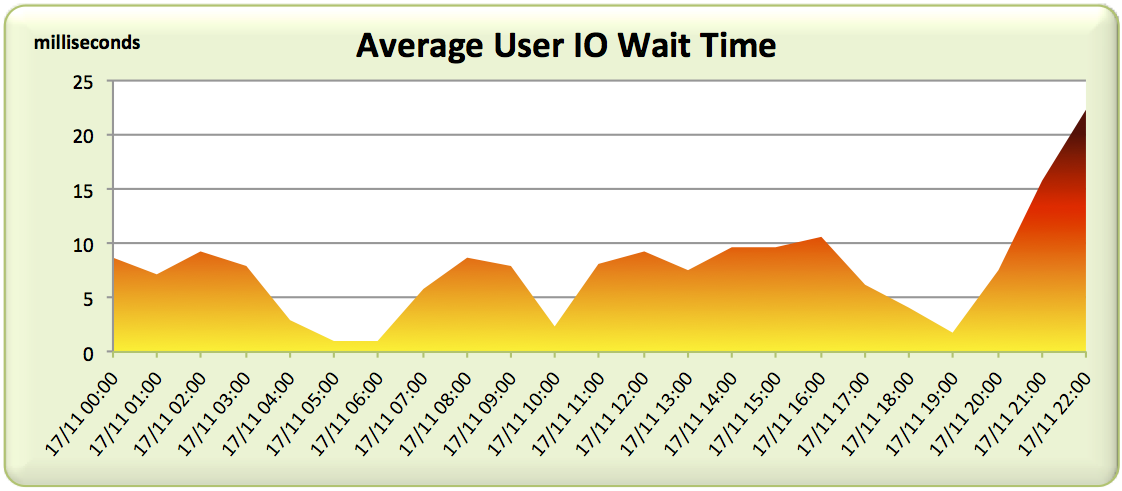
Not what we expected. The 5am-6am slot is showing the best latency figures for the entire day! And this is when users are complaining?
Averages Lie
A disk array like this usually has a reasonably large DRAM cache and quite possibly a set of SSDs being used for further caching or tiering of data. If a physical read can be satisfied from the cache, it will likely be serviced in under a millisecond. But if we experience a cache miss, we’re forced to pay the penalty of mechanical latency and wait for many milliseconds. Thus there are two ranges of response times: sub-millisecond and many milliseconds.
Average wait times won’t show this because they are simply the average of all waits over the period of the AWR report (an entire hour in this case). What if many of the reads are cache hits but some still miss? Maybe it’s possible that there are enough misses to cause users to complain, but enough hits to make the average look acceptable?
Luckily, there is another section in the AWR report which can help here: the Wait Event Histogram. Here’s the histograms covering db file sequential read waits (random physical reads) for our 24 hour period:
$ cat header.txt; for file in `ls -1`; do
grep -A 40 "Wait Event Histogram" $file | grep "db file sequential read" | head -1
done
                                                    % of Waits
                                 -----------------------------------------------
                           Total
Event                      Waits  <1ms  <2ms  <4ms  <8ms <16ms <32ms  <=1s   >1s
-------------------------- ----- ----- ----- ----- ----- ----- ----- ----- -----
db file sequential read     3329  99.2    .8    .0    .0    .0    .0    .0    .0
db file sequential read     3487  99.4    .6    .0    .0
db file sequential read    35.4K  21.0   1.2   2.5  23.2  39.0  11.9   1.1
db file sequential read    82.9K  34.6   1.8   3.4  15.9  31.9  11.2   1.2
db file sequential read    428.6  67.4   2.1   2.5  10.1  15.2   2.4    .3
db file sequential read    4440.  92.6   1.3   1.2   1.9   2.6    .4    .0
db file sequential read    2013K  91.7   1.4   1.2   2.1   3.0    .5    .0
db file sequential read    131.7  45.7   1.1   2.8  15.6  29.1   5.4    .3
db file sequential read    76.3K  20.7   1.7   2.8  21.7  44.0   8.7    .4
db file sequential read    83.7K  31.1   1.1   2.4  16.6  38.1  10.0    .7
db file sequential read    430.4  79.6   1.5   2.0   4.4   9.3   2.9    .3
db file sequential read    106.6  32.3   1.7   3.0  15.4  36.1  10.3   1.2
db file sequential read      94K  23.8   1.8   2.7  16.6  41.7  12.1   1.2
db file sequential read    248.6  36.0   1.8   2.9  14.8  34.5   8.9   1.1
db file sequential read    202.5  31.9   1.4   2.0   9.0  38.0  16.1   1.6
db file sequential read    237.7  20.2   1.9   2.9  17.7  43.5  12.5   1.2
db file sequential read    49.5K   9.4   1.0   2.7  24.1  48.0  13.6   1.1
db file sequential read    75.6K  42.4   1.5   3.0  16.9  29.9   5.9    .5
db file sequential read    88.7K  61.4   1.3   2.5  12.4  18.2   3.8    .4
db file sequential read    644.3  84.3   1.0   1.5   4.3   7.3   1.5    .2
db file sequential read    61.3K  34.9   6.9   4.4  11.0  31.2  10.5   1.1
db file sequential read      330  96.7   3.1    .2    .0    .0
db file sequential read      12K  88.7   9.5   1.2    .4    .2    .1    .0    .0
Now the problem becomes clear. Although many reads are hitting the cache (<1ms bucket), there are an awful lot that are missing. The <2ms and <4ms buckets are virtually empty and then around <8ms we start to see big numbers again. Those are cache misses which incur the penalty of seek time on a hard disk drive somewhere in the array.
What’s more, it’s clear that the array is under some pressure because in many of the AWR reports there are substantial waits in the <16ms and above buckets. I’ve highlighted in red the occasions where over one third of read requests took over 8ms. That’s exactly the sort of behaviour that is making people replace disks with flash.
Let’s visualise the above data. I’ve gone back to the older set of AWR reports and graphed the histogram buckets to see if we can get a feel for the distribution of waits:

As you can see, I’ve tried to go for a heat map-style colour scheme, with green indicating cache hits on the storage array and the colours moving from yellow through orange to red indicating cache misses which result in disk drive seek time. There are also some real outliers in black where requests took over one thousand milliseconds to be serviced (ouch).
Another way to look at it is to make the picture clearer by reducing the detail. In the graph below I’ve simply assumed that everything sub-millisecond is a storage array cache hit and everything else is a miss:

Clearly there are a lot of physical reads paying the price of mechanical latency here.
Conclusion
What this customer does next is up for debate – there are more than just technical issues to consider. But the point of this post is to illustrate that while average wait times are great for getting a rough feel of how a system is behaving, they also offer huge scope to lose details. And sometimes those details are important. The devil, as they say, is truly in the detail…
Update: January 2015 – I have now added the ability to read Wait Event Histograms to my awr-parser.sh script which you can find on my Useful Scripts page…
Oracle, Parallelism and Direct Path Reads… on Flash

Guest Post
This is another guest post from my buddy Nate Fuzi, who performs the same role as me for Violin but is based in the US instead of EMEA. Because he’s an American, Nate believes that “football” is played using your hands and that the ball is actually egg-shaped. This is of course ridiculous, because as the entire rest of the world knows, this is football whereas the game Nate is thinking of is actually called “HandEgg”. Now that we’ve cleared that up, over to you, Nate:
Lately, I’ve been running into much confusion around Oracle’s direct path IO functionality (11g+) and, unusually, not all of that confusion is my own. There is a perplexing lack of literature and experimentation with direct path IO on the Internet today. Seriously, I’ve looked. I decided I needed to better understand this event and its timing in order to properly extend suggestions to customers. I set about trying to prove some things I thought I knew, and I managed to confirm several suspicions but also surprised myself with some unexpected results. I’d like to share these in hopes of clarifying this event for everyone in practical terms.
Direct Path IO Background
To set the stage a bit, at the highest level, Oracle created the direct path IO event to describe an IO executed by an Oracle process that reads into (or writes from) the process global area (think of this as the session’s private memory) directly from (to) storage, bypassing the Oracle buffer cache. The rationale is this: full table scans of large tables into the buffer cache consume a lot of space, pushing out likely useful buffers in favor of buffers unlikely to be needed again in the near future. Reading directly into the process global area instead of the shared global area keeps full table scans from polluting the buffer cache and diminishing its overall effectiveness. Since the direct path IO is used for full scanning large objects, it looks to the database’s DB_FILE_MULTIBLOCK_READ_COUNT (henceforth referred to as DBMRC) setting for guidance on the size of IO calls to issue.
Makes sense. But what’s been confusing me is the apparently inconsistent performance of direct path reads and writes, even against Violin’s all-flash arrays. With random and other multi-block IO events showing very low, consistent performance, direct path reads can still be all over the board. How is that? Is it truly impacting performance? How can I make it better, or should I even try? After seeing this at a number of customer installations, I decided to run some tests on a smallish lab server attached to a single Violin array.
The Setup
I have a test database with a number of tables almost exactly 125GB in size full of randomized data. Full-scanning one of these tables via “select count(*)” was plenty to exercise the direct path read repeatedly, varying parallelism and DBMRC. My goal was to see the effect of these settings on both elapsed time and perceived latency. With an 8K database block size (RHEL 6.3, Oracle 12.1.0.1, ASM), I ran the test with DBMRC set to 4, then 8, 16, and finally 128. I ran each test with no parallelism, then with “parallel 16” hinted. So what did I see?
Test Results
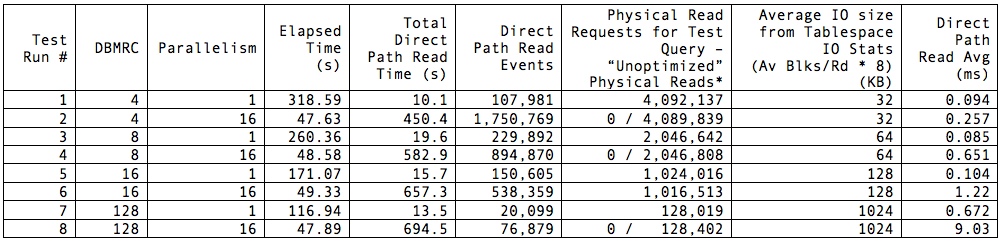
Note that elapsed times represent the time my query returned to the SQL*Plus prompt with the “set timing on” directive applied to my session and are not 100% representative of time spent on the database but are close enough for my purposes. Total direct path read (DPR) time was pulled from the respective AWR report after execution finished. I asterisked the Physical Read Requests column because some of the reports showed 0 physical reads for the test SQL, while it was clear from the total physical reads that my read operation was the only possible culprit; therefore I felt justified in attributing that total (minus a few here and there from the AWR snapshotting process) to the test SQL. Note also that the best elapsed time was achieved with the lowest DBMRC and parallel 16. Worst time by far was also obtained with DBMRC set to 4 but without parallelism—although it accumulated the least amount of wait time on DPR. In general, throwing more cores at the problem improved performance hugely; not surprising, but noteworthy. We know that flash does not benefit from multi-block IO as a rule: at the lowest level, every IO is effectively a random IO, and larger blocks / groups of blocks are fetched independently, assembled, and returned to the caller as a single unit. However, there is a definite overhead in issuing IO requests, waiting for the calls to return, and consuming the requested data. This is evidenced by the high elapsed time for the single-threaded run with DBMRC set to 4: the least amount of reported IO wait time still contributed to the longest overall elapsed time.
So what do these values tell us? For one thing, parallelism is your friend. One core performing a FTS just isn’t going to get the job done nearly as quickly as multiple cores. Also, parallelism vastly trumps DBMRC as a tool for improving performance on flash when CPU resources are available. Performance between parallel processing runs was within 2%, no matter what the DBMRC setting. This I expected, having come into the testing with the assumption that DBMRC was irrelevant when working with flash. I was surprised at the exceedingly high elapsed time with the single-threaded query using small DBMRC. I would expect that to be higher than the others, but not nearly 3X longer than the single-threaded run with DBMRC at 128.
These revelations are mildly interesting, but what I find much more curious is the difference in reported DPR latency. Certainly, a highly parallel execution can accumulate more database time than wall clock time for any event. But we can tell from the elapsed times that, when we’re not starving the database for parallelism, DBMRC is practically meaningless when applied to flash. Yet the calculation of the average latency of the event is mysterious in that 1) 16 threads operating with DBMRC of 128 experiences roughly 4X the number of waits the single-threaded execution performs; 2) it does so apparently at about 13X the average latency of the single-threaded run; and 3) it racks up about 51X the amount of total DPR wait time.
What’s worse is that DPR stats are very strangely represented in the Tablespace IO stats section of the report. Here’s the snippet from test run #2:
                     Av       Av     Av      1-bk  Av 1-bk          Writes   Buffer  Av Buf
Tablespace   Reads   Rds/s  Rd(ms) Blks/Rd   Rds/s  Rd(ms)  Writes   avg/s    Waits  Wt(ms)
---------- ------- ------- ------- ------- ------- ------- ------- ------- -------- -------
DEMO       4.1E+06  49,395     0.0     4.0       2     0.0       0       0        0     0.0
We have to cut Oracle some slack on the Av Rds/s value here because it’s now averaging over the time it took me to start the test after my initial snapshot, then realize the test was done and execute another AWR snapshot to end the reporting period. Fine. But an average read time of 0.0ms?! Clearly, Oracle is recording some number of reads, but it’s not reporting timing on them at all in this section of the report. We have to look to the SQL Ordered by Physical Reads (Unoptimized) section of the report to confirm it’s actually doing a relevant number of IO requests:
-> Total Physical Read Requests:       4,092,389
-> Captured SQL account for    0.0% of Total
-> Total UnOptimized Read Requests:       4,092,389
-> Captured SQL account for    0.0% of Total
-> Total Optimized Read Requests:               1
-> Captured SQL account for    0.0% of Total

[some lines removed]

UnOptimized   Physical              UnOptimized
  Read Reqs   Read Reqs Executions Reqs per Exe   %Opt %Total    SQL Id
----------- ----------- ---------- ------------ ------ ------ -------------
          0           0          1          0.0    N/A    0.0 4kpvpt49hm3nf
Module: SQL*Plus
   PDB: DEMO
select /*+ parallel 16 */ count(*) from demo.length100_1
Oh, wait. Oracle doesn’t credit my query with any physical read requests. I have to look at the total just above in the report, and see that only the AWR snapshot performed any other IO on the system, and subtract that from the total. Sigh. At least ~4.1M reads at 32KB comes close to 125GB.
So what gives, Oracle? I’ve read some Oracle notes and other blogs on the subject of DPR, and they suggest the wait event is not necessarily triggered when the IO call is initially issued, but instead when the session decides it needs all outstanding DPR IOs it has issued to complete before moving on—or it fills up all its “slots” and has to wait for those to free up. Thus the under-reporting of the actual number of DPR waits and the artificially high wait time for each of those waits: fewer waits, along with potentially many IO requests outstanding when the wait is triggered and timing starts. But nowhere in all of this is there a set of numbers that I can trust to accurately describe my DPR performance. The fact that DPR IO is completely left out of tablespace timings is seriously troubling: we trust these stats to determine “hot” tablespaces and under-performing mount points. This throws all kinds of doubt into the mix.
What can I say about Oracle’s DPR at this point? While it works just fine and serves its purpose, the instrumentation appears to be lacking, even in Oracle 12.1. After this testing, I feel even more confident telling customers to ignore the latency reported for this event—at least for now. And I’ve confirmed my belief that, with any sort of parallelism enabled on your database, DBMRC is largely irrelevant for flash storage and only adds a mystery factor to reported latencies. Yes, setting this to a low value will affect costing of FTS vs. index access, so you should verify that plans currently employing FTS that you want to remain that way still do. This is easy enough with an alter session and explain plan. With that, Oracle, the ball is in your court: please define your terms, fix your instrumentation around DPR, or tell customers to stop worrying about DPR latencies. Meanwhile, I’m going to advise people who are otherwise happy with their performance but want better latency numbers in their reports to set DBMRC lower and get on with their lives.
Viewing ASM trace files in VIM: Which Way Do You Use?

A couple of people have asked me recently about a classic problem that most DBAs know: how to view ASM trace files in the VIM editor when the filenames start with a + character. To my surprise, there are actually quite a few different ways of doing it. Since it’s come up, I thought I’d list a few of them here… If you have another one to add, feel free to comment. I know that most people reading this already have an answer, I’m just interested in who uses the most efficient one…
The Problem
VIM is a text editor used in many different operating systems. You know the one, it’s incredibly powerful, utterly incomprehensible to the newcomer… and will forever have more options than you can remember. I mean, just check out the cheat sheet:

People love or hate vim (I love it), but it’s often used on Linux systems simply because it’s always there. The problem comes when you want to look at ASM trace files, because they have a silly name:
oracle@server3 trace]$ pwd
/u01/app/oracle/diag/asm/+asm/+ASM/trace
[oracle@server3 trace]$ ls -l +ASM_ora_27425*
-rw-r----- 1 oracle oinstall 20625 Aug 20 15:42 +ASM_ora_27425.trc
-rw-r----- 1 oracle oinstall   528 Aug 20 15:42 +ASM_ora_27425.trm
Oracle trace files tend to have names in the format <oracle-sid>-<process-name>-<process-id>.trc, which is fine until the Oracle SID is that of the Automatic Storage Management instance, i.e. “+ASM”.
It’s that “+” prefix character that does it:
[oracle@server3 trace]$ vim +ASM_ora_27425.trc

Error detected while processing command line:
E492: Not an editor command: ASM_ora_27425.trc
Press ENTER or type command to continue
Why does this happen? Well because in among the extensive options of vim are to be found the following:
[oracle@server3 trace]$ man vim
...
OPTIONS
       The  options may be given in any order, before or after filenames.  Options without an argument can be combined after a
       single dash.

       +[num]      For the first file the cursor will be positioned on line "num".  If "num" is missing, the  cursor  will  be
                   positioned on the last line.

       +/{pat}     For  the first file the cursor will be positioned on the first occurrence of {pat}.  See ":help search-pat-
                   tern" for the available search patterns.

       +{command}
...
So… the plus character is actually being interpreted by VIM as an option. Surely we can just escape it then, right?
[oracle@server3 trace]$ vim \+ASM_ora_27425.trc

Error detected while processing command line:
E492: Not an editor command: ASM_ora_27425.trc
Press ENTER or type command to continue
Nope. And neither single nor double quotes around the filename work either. So what are the options?
Solution 1: Make Sure The “+” Isn’t The Prefix
Simple, but effective. If the + character isn’t leading the filename, VIM won’t try to interpret it. So instead of a relative filename, I could use the absolute:
[oracle@server3 trace]$ vi /u01/app/oracle/diag/asm/+asm/+ASM/trace/+ASM_ora_27425.trc
Or even just use a ./ to denote the current directory:
[oracle@server3 trace]$ vi ./+ASM_ora_27425.trc
Solution 2: Double Dash
Even simpler, but less well known (I think?) is the double-dash or hyphen option. If you browse the VIM man page a little further on, you’ll find this:
[oracle@server3 trace]$ man vim
...
 --          Denotes  the end of the options.  Arguments after this will be handled as a file name.  This can be used to
                   edit a filename that starts with a ’-’.
...
And it works perfectly:
[oracle@server3 trace]$ vi -- +ASM_ora_27425.trc
Solution 3: Use Find and -Exec
Another, slightly messy option is to use the find command to send the file to VIM. I know people who still do this, despite it being more work than the other options – sometimes a lazy hack can become unconscious habit:
[oracle@server3 trace]$ find . -name +ASM_ora_27425.trc -exec vi {} \;
In fact, I actually know somebody who used to look up the file’s inode number and then pass that into find:
[oracle@server3 trace]$ ls -li +ASM_ora_27425*
138406 -rw-r----- 1 oracle oinstall 20625 Aug 20 15:42 +ASM_ora_27425.trc
138407 -rw-r----- 1 oracle oinstall   528 Aug 20 15:42 +ASM_ora_27425.trm
[oracle@server3 trace]$ find . -inum 138406 -exec vi {} \;
Luckily nobody will ever know who that somebody is*.
Solution 4: Rename It
My least favourite option, but it’s actually quite efficient. Simple create a copy of the file with a new name that doesn’t contain a plus – luckily the cp command doesn’t care about the + prefix:
[oracle@server3 trace]$ cp +ASM_ora_27425.trc me.trc
[oracle@server3 trace]$ vi me.trc
Of course, you’ll want to tidy up that new file afterwards and not just leave it lying around… won’t you?
Less Is More
Maybe you’re not the sort of person that likes to use VIM. Maybe you prefer the more basic OS tools like cat (which works fine on ASM trace files), or more (which doesn’t), or even less.
In fact, less has pretty much the same options as VIM, which means you can use all of the above solutions with it. If you are using more, you cannot pass this a double dash but the others will work. And if you’re using cat, good luck to you… I hope you have a big screen.
* Yes, of course, it was me.
Oracle 12.1.0.2 ASM Filter Driver: Advanced Format Fail

[Please note that a more up-to-date post on this subject can be found here]
In my previous post on the subject of the new ASM Filter Driver (AFD) feature introduced in Oracle’s 12.1.0.2 patchset, I installed the AFD to see how it fulfilled its promise that it “filters out all non-Oracle I/Os which could cause accidental overwrites“. However, because I was ten minutes away from my summer vacation at the point of finishing that post, I didn’t actually get round to writing about what happens when you try and create ASM diskgroups on the devices it presents.
Obviously I’ve spent the intervening period constantly worrying about this oversight – indeed, it was only through the judicious application of good food and drink plus some committed relaxation in the sun that I was able to pull through. However, I’m back now and it seems like time to rectify that mistake. So here goes.
Creating ASM Diskgroups with the ASM Filter Driver
It turns out I need not have worried, because it doesn’t work right now… at least, not for me. Here’s why:
First of all, I installed Oracle 12.1.0.2 Grid Infrastructure. I then labelled some block devices presented from my Violin storage array. As I’ve already pasted all the output from those two steps in the previous post, I won’t repeat myself.
The next step is therefore to create a diskgroup. Since I’ve only just come back from holiday and so I’m still half brain-dead, I’ll choose the simple route and fire up the ASM Configuration Assistant (ASMCA) so that I don’t have to look up any of that nasty SQL. Here goes:

But guess what happened when I hit the OK button? It failed, bigtime. Here’s the alert log – if you don’t like huge amounts of meaningless text I suggest you skip down… a lot… (although thinking about it, my entire blog could be described as meaningless text):
SQL> CREATE DISKGROUP DATA EXTERNAL REDUNDANCY  DISK 'AFD:DATA1' SIZE 72704M ,
'AFD:DATA2' SIZE 72704M ,
'AFD:DATA3' SIZE 72704M ,
'AFD:DATA4' SIZE 72704M ,
'AFD:DATA5' SIZE 72704M ,
'AFD:DATA6' SIZE 72704M ,
'AFD:DATA7' SIZE 72704M ,
'AFD:DATA8' SIZE 72704M  ATTRIBUTE 'compatible.asm'='12.1.0.0.0','au_size'='1M' /* ASMCA */
Fri Jul 25 16:25:33 2014
WARNING: Library 'AFD Library - Generic , version 3 (KABI_V3)' does not support advanced format disks
Fri Jul 25 16:25:33 2014
NOTE: Assigning number (1,0) to disk (AFD:DATA1)
NOTE: Assigning number (1,1) to disk (AFD:DATA2)
NOTE: Assigning number (1,2) to disk (AFD:DATA3)
NOTE: Assigning number (1,3) to disk (AFD:DATA4)
NOTE: Assigning number (1,4) to disk (AFD:DATA5)
NOTE: Assigning number (1,5) to disk (AFD:DATA6)
NOTE: Assigning number (1,6) to disk (AFD:DATA7)
NOTE: Assigning number (1,7) to disk (AFD:DATA8)
NOTE: initializing header (replicated) on grp 1 disk DATA1
NOTE: initializing header (replicated) on grp 1 disk DATA2
NOTE: initializing header (replicated) on grp 1 disk DATA3
NOTE: initializing header (replicated) on grp 1 disk DATA4
NOTE: initializing header (replicated) on grp 1 disk DATA5
NOTE: initializing header (replicated) on grp 1 disk DATA6
NOTE: initializing header (replicated) on grp 1 disk DATA7
NOTE: initializing header (replicated) on grp 1 disk DATA8
NOTE: initializing header on grp 1 disk DATA1
NOTE: initializing header on grp 1 disk DATA2
NOTE: initializing header on grp 1 disk DATA3
NOTE: initializing header on grp 1 disk DATA4
NOTE: initializing header on grp 1 disk DATA5
NOTE: initializing header on grp 1 disk DATA6
NOTE: initializing header on grp 1 disk DATA7
NOTE: initializing header on grp 1 disk DATA8
NOTE: Disk 0 in group 1 is assigned fgnum=1
NOTE: Disk 1 in group 1 is assigned fgnum=2
NOTE: Disk 2 in group 1 is assigned fgnum=3
NOTE: Disk 3 in group 1 is assigned fgnum=4
NOTE: Disk 4 in group 1 is assigned fgnum=5
NOTE: Disk 5 in group 1 is assigned fgnum=6
NOTE: Disk 6 in group 1 is assigned fgnum=7
NOTE: Disk 7 in group 1 is assigned fgnum=8
NOTE: initiating PST update: grp = 1
Fri Jul 25 16:25:33 2014
GMON updating group 1 at 1 for pid 7, osid 16745
NOTE: group DATA: initial PST location: disk 0000 (PST copy 0)
NOTE: set version 1 for asmCompat 12.1.0.0.0
Fri Jul 25 16:25:33 2014
NOTE: PST update grp = 1 completed successfully
NOTE: cache registered group DATA 1/0xD9B6AE8D
NOTE: cache began mount (first) of group DATA 1/0xD9B6AE8D
NOTE: cache is mounting group DATA created on 2014/07/25 16:25:33
NOTE: cache opening disk 0 of grp 1: DATA1 label:DATA1
NOTE: cache opening disk 1 of grp 1: DATA2 label:DATA2
NOTE: cache opening disk 2 of grp 1: DATA3 label:DATA3
NOTE: cache opening disk 3 of grp 1: DATA4 label:DATA4
NOTE: cache opening disk 4 of grp 1: DATA5 label:DATA5
NOTE: cache opening disk 5 of grp 1: DATA6 label:DATA6
NOTE: cache opening disk 6 of grp 1: DATA7 label:DATA7
NOTE: cache opening disk 7 of grp 1: DATA8 label:DATA8
NOTE: cache creating group 1/0xD9B6AE8D (DATA)
NOTE: cache mounting group 1/0xD9B6AE8D (DATA) succeeded
WARNING: cache read a corrupt block: group=1(DATA) dsk=0 blk=1 disk=0 (DATA1) incarn=3493224069 au=0 blk=1 count=1
Fri Jul 25 16:25:33 2014
Errors in file /u01/app/oracle/diag/asm/+asm/+ASM/trace/+ASM_ora_16745.trc:
ORA-15196: invalid ASM block header [kfc.c:29297] [endian_kfbh] [2147483648] [1] [0 != 1]
NOTE: a corrupted block from group DATA was dumped to /u01/app/oracle/diag/asm/+asm/+ASM/trace/+ASM_ora_16745.trc
WARNING: cache read (retry) a corrupt block: group=1(DATA) dsk=0 blk=1 disk=0 (DATA1) incarn=3493224069 au=0 blk=1 count=1
Fri Jul 25 16:25:33 2014
Errors in file /u01/app/oracle/diag/asm/+asm/+ASM/trace/+ASM_ora_16745.trc:
ORA-15196: invalid ASM block header [kfc.c:29297] [endian_kfbh] [2147483648] [1] [0 != 1]
ORA-15196: invalid ASM block header [kfc.c:29297] [endian_kfbh] [2147483648] [1] [0 != 1]
WARNING: cache read (retry) a corrupt block: group=1(DATA) dsk=0 blk=1 disk=0 (DATA1) incarn=3493224069 au=11 blk=1 count=1
Fri Jul 25 16:25:33 2014
Errors in file /u01/app/oracle/diag/asm/+asm/+ASM/trace/+ASM_ora_16745.trc:
ORA-15196: invalid ASM block header [kfc.c:29297] [endian_kfbh] [2147483648] [1] [0 != 1]
ORA-15196: invalid ASM block header [kfc.c:29297] [endian_kfbh] [2147483648] [1] [0 != 1]
ORA-15196: invalid ASM block header [kfc.c:29297] [endian_kfbh] [2147483648] [1] [0 != 1]
NOTE: a corrupted block from group DATA was dumped to /u01/app/oracle/diag/asm/+asm/+ASM/trace/+ASM_ora_16745.trc
WARNING: cache read (retry) a corrupt block: group=1(DATA) dsk=0 blk=1 disk=0 (DATA1) incarn=3493224069 au=11 blk=1 count=1
Fri Jul 25 16:25:33 2014
Errors in file /u01/app/oracle/diag/asm/+asm/+ASM/trace/+ASM_ora_16745.trc:
ORA-15196: invalid ASM block header [kfc.c:29297] [endian_kfbh] [2147483648] [1] [0 != 1]
ORA-15196: invalid ASM block header [kfc.c:29297] [endian_kfbh] [2147483648] [1] [0 != 1]
ORA-15196: invalid ASM block header [kfc.c:29297] [endian_kfbh] [2147483648] [1] [0 != 1]
ORA-15196: invalid ASM block header [kfc.c:29297] [endian_kfbh] [2147483648] [1] [0 != 1]
ERROR: cache failed to read group=1(DATA) dsk=0 blk=1 from disk(s): 0(DATA1) 0(DATA1)
ORA-15196: invalid ASM block header [kfc.c:29297] [endian_kfbh] [2147483648] [1] [0 != 1]
ORA-15196: invalid ASM block header [kfc.c:29297] [endian_kfbh] [2147483648] [1] [0 != 1]
ORA-15196: invalid ASM block header [kfc.c:29297] [endian_kfbh] [2147483648] [1] [0 != 1]
ORA-15196: invalid ASM block header [kfc.c:29297] [endian_kfbh] [2147483648] [1] [0 != 1]

NOTE: cache initiating offline of disk 0 group DATA
NOTE: process _user16745_+asm (16745) initiating offline of disk 0.3493224069 (DATA1) with mask 0x7e in group 1 (DATA) with client assisting
NOTE: initiating PST update: grp 1 (DATA), dsk = 0/0xd0365e85, mask = 0x6a, op = clear
Fri Jul 25 16:25:34 2014
GMON updating disk modes for group 1 at 2 for pid 7, osid 16745
ERROR: disk 0(DATA1) in group 1(DATA) cannot be offlined because the disk group has external redundancy.
Fri Jul 25 16:25:34 2014
ERROR: too many offline disks in PST (grp 1)
Fri Jul 25 16:25:34 2014
ERROR: no read quorum in group: required 1, found 0 disks
ERROR: Could not read PST for grp 1. Force dismounting the disk group.
Fri Jul 25 16:25:34 2014
NOTE: halting all I/Os to diskgroup 1 (DATA)
Fri Jul 25 16:25:34 2014
ERROR: no read quorum in group: required 1, found 0 disks
ASM Health Checker found 1 new failures
Fri Jul 25 16:25:36 2014
ERROR: no read quorum in group: required 1, found 0 disks
Fri Jul 25 16:25:36 2014
ERROR: Could not read PST for grp 1. Force dismounting the disk group.
Fri Jul 25 16:25:36 2014
ERROR: no read quorum in group: required 1, found 0 disks
ERROR: Could not read PST for grp 1. Force dismounting the disk group.
Fri Jul 25 16:25:36 2014
ERROR: no read quorum in group: required 1, found 0 disks
ERROR: Could not read PST for grp 1. Force dismounting the disk group.
Fri Jul 25 16:25:37 2014
NOTE: AMDU dump of disk group DATA initiated at /u01/app/oracle/diag/asm/+asm/+ASM/trace
Errors in file /u01/app/oracle/diag/asm/+asm/+ASM/trace/+ASM_ora_16745.trc  (incident=3257):
ORA-15335: ASM metadata corruption detected in disk group 'DATA'
ORA-15130: diskgroup "DATA" is being dismounted
ORA-15066: offlining disk "DATA1" in group "DATA" may result in a data loss
ORA-15196: invalid ASM block header [kfc.c:29297] [endian_kfbh] [2147483648] [1] [0 != 1]
ORA-15196: invalid ASM block header [kfc.c:29297] [endian_kfbh] [2147483648] [1] [0 != 1]
ORA-15196: invalid ASM block header [kfc.c:29297] [endian_kfbh] [2147483648] [1] [0 != 1]
ORA-15196: invalid ASM block header [kfc.c:29297] [endian_kfbh] [2147483648] [1] [0 != 1]
Incident details in: /u01/app/oracle/diag/asm/+asm/+ASM/incident/incdir_3257/+ASM_ora_16745_i3257.trc
Fri Jul 25 16:25:37 2014
Sweep [inc][3257]: completed
Fri Jul 25 16:25:37 2014
SQL> alter diskgroup DATA check
System State dumped to trace file /u01/app/oracle/diag/asm/+asm/+ASM/incident/incdir_3257/+ASM_ora_16745_i3257.trc
NOTE: erasing header (replicated) on grp 1 disk DATA1
NOTE: erasing header (replicated) on grp 1 disk DATA2
NOTE: erasing header (replicated) on grp 1 disk DATA3
NOTE: erasing header (replicated) on grp 1 disk DATA4
NOTE: erasing header (replicated) on grp 1 disk DATA5
NOTE: erasing header (replicated) on grp 1 disk DATA6
NOTE: erasing header (replicated) on grp 1 disk DATA7
NOTE: erasing header (replicated) on grp 1 disk DATA8
NOTE: erasing header on grp 1 disk DATA1
NOTE: erasing header on grp 1 disk DATA2
NOTE: erasing header on grp 1 disk DATA3
NOTE: erasing header on grp 1 disk DATA4
NOTE: erasing header on grp 1 disk DATA5
NOTE: erasing header on grp 1 disk DATA6
NOTE: erasing header on grp 1 disk DATA7
NOTE: erasing header on grp 1 disk DATA8
Fri Jul 25 16:25:37 2014
NOTE: cache dismounting (clean) group 1/0xD9B6AE8D (DATA)
NOTE: messaging CKPT to quiesce pins Unix process pid: 16745, image: oracle@server3.local (TNS V1-V3)
NOTE: dbwr not being msg'd to dismount
NOTE: LGWR not being messaged to dismount
NOTE: cache dismounted group 1/0xD9B6AE8D (DATA)
NOTE: cache ending mount (fail) of group DATA number=1 incarn=0xd9b6ae8d
NOTE: cache deleting context for group DATA 1/0xd9b6ae8d
Fri Jul 25 16:25:37 2014
GMON dismounting group 1 at 3 for pid 7, osid 16745
Fri Jul 25 16:25:37 2014
NOTE: Disk DATA1 in mode 0x7f marked for de-assignment
NOTE: Disk DATA2 in mode 0x7f marked for de-assignment
NOTE: Disk DATA3 in mode 0x7f marked for de-assignment
NOTE: Disk DATA4 in mode 0x7f marked for de-assignment
NOTE: Disk DATA5 in mode 0x7f marked for de-assignment
NOTE: Disk DATA6 in mode 0x7f marked for de-assignment
NOTE: Disk DATA7 in mode 0x7f marked for de-assignment
NOTE: Disk DATA8 in mode 0x7f marked for de-assignment
ERROR: diskgroup DATA was not created
ORA-15018: diskgroup cannot be created
ORA-15335: ASM metadata corruption detected in disk group 'DATA'
ORA-15130: diskgroup "DATA" is being dismounted
Fri Jul 25 16:25:37 2014
ORA-15032: not all alterations performed
ORA-15066: offlining disk "DATA1" in group "DATA" may result in a data loss
ORA-15001: diskgroup "DATA" does not exist or is not mounted
ORA-15196: invalid ASM block header [kfc.c:29297] [endian_kfbh] [2147483648] [1] [0 != 1]
Now then. First of all, thanks for making it this far – I promise not to do that again in this post. Secondly, in case you really did just hit page down *a lot* you might want to skip back up and look for the bits I’ve conveniently highlighted in red. Specifically, this bit:
WARNING: Library 'AFD Library - Generic , version 3 (KABI_V3)' does not support advanced format disks
Many modern storage platforms use Advanced Format – if you want to know what that means, read here. The idea that AFD doesn’t support advanced format is somewhat alarming – and indeed incorrect, according to interactions I have subsequently had with Oracle’s ASM Product Management people. From what I understand, the problem is tracked as bug 19297177 (currently unpublished) and is caused by AFD incorrectly checking the physical blocksize of the storage device (4k) instead of the logical block size (which was 512 bytes). I currently have a request open with Oracle Support for the patch, so when that arrives I will re-test and add another blog article.
Until then, I guess I might as well take another well-earned vacation?
Oracle 12.1.0.2 ASM Filter Driver: First Impressions
This is a very quick post, because I’m about to log off and take an extended summer holiday (or vacation as my crazy American friends call it… but then they call football “soccer” too). Before I go, I wanted to document my initial findings with the new ASM Filter Driver feature introduced in this week’s 12.1.0.2 patchset. [For a more recent post on this topic, read here]
Currently a Linux-only feature, the ASM Filter Driver (or AFD) is a replacement for ASMLib and is described by Oracle as follows:
Oracle ASM Filter Driver (Oracle ASMFD) is a kernel module that resides in the I/O path of the Oracle ASM disks. Oracle ASM uses the filter driver to validate write I/O requests to Oracle ASM disks.
The Oracle ASMFD simplifies the configuration and management of disk devices by eliminating the need to rebind disk devices used with Oracle ASM each time the system is restarted.
The Oracle ASM Filter Driver rejects any I/O requests that are invalid. This action eliminates accidental overwrites of Oracle ASM disks that would cause corruption in the disks and files within the disk group. For example, the Oracle ASM Filter Driver filters out all non-Oracle I/Os which could cause accidental overwrites.
Interesting, eh? So let’s find out how that works.
Installation
I found this a real pain as you need to have 12.1.0.2 installed before the AFD is available to label your disks, yet the default OUI mode wants to create an ASM diskgroup… and you cannot do that without any labelled disks.
The only solution I could come up with was to perform a software-only install, which in itself is a pain. I’ll skip the numerous screenshots of that part though and just skip straight to the bit where I have 12.1.0.2 Grid Infrastructure installed.
I’m following these instructions because I am using a single-instance Oracle Restart system rather than a true cluster.
First of all we need to do this:
[oracle@server3 ~]$ $ORACLE_HOME/bin/asmcmd dsset 'AFD:*'

[oracle@server3 ~]$ $ORACLE_HOME/bin/asmcmd dsget
parameter:AFD:*
profile:AFD:*
[oracle@server3 ~]$ srvctl config asm
ASM home:
Password file:
ASM listener: LISTENER
Spfile: /u01/app/oracle/admin/+ASM/pfile/spfile+ASM.ora
ASM diskgroup discovery string: AFD:*
Then we need to stop HAS and run the AFD_CONFIGURE command:
[root@server3 ~]# $ORACLE_HOME/bin/crsctl stop has -f
CRS-2791: Starting shutdown of Oracle High Availability Services-managed resources on 'server3'
CRS-2673: Attempting to stop 'ora.asm' on 'server3'
CRS-2673: Attempting to stop 'ora.evmd' on 'server3'
CRS-2673: Attempting to stop 'ora.LISTENER.lsnr' on 'server3'
CRS-2677: Stop of 'ora.LISTENER.lsnr' on 'server3' succeeded
CRS-2677: Stop of 'ora.evmd' on 'server3' succeeded
CRS-2677: Stop of 'ora.asm' on 'server3' succeeded
CRS-2673: Attempting to stop 'ora.cssd' on 'server3'
CRS-2677: Stop of 'ora.cssd' on 'server3' succeeded
CRS-2793: Shutdown of Oracle High Availability Services-managed resources on 'server3' has completed
CRS-4133: Oracle High Availability Services has been stopped.

[root@server3 ~]# $ORACLE_HOME/bin/asmcmd afd_configure
Connected to an idle instance.
AFD-627: AFD distribution files found.
AFD-636: Installing requested AFD software.
AFD-637: Loading installed AFD drivers.
AFD-9321: Creating udev for AFD.
AFD-9323: Creating module dependencies - this may take some time.
AFD-9154: Loading 'oracleafd.ko' driver.
AFD-649: Verifying AFD devices.
AFD-9156: Detecting control device '/dev/oracleafd/admin'.
AFD-638: AFD installation correctness verified.
Modifying resource dependencies - this may take some time.
ASMCMD-9524: AFD configuration failed 'ERROR: OHASD start failed'
Er… that’s not really what I had in mind. But hey, let’s carry on regardless:
[root@server3 oracleafd]# $ORACLE_HOME/bin/asmcmd afd_state
Connected to an idle instance.
ASMCMD-9526: The AFD state is 'LOADED' and filtering is 'DEFAULT' on host 'server3.local'

[root@server3 oracleafd]# $ORACLE_HOME/bin/crsctl start has
CRS-4123: Oracle High Availability Services has been started.
Ok it seems to be working. I wonder what it’s done?
Investigation
The first thing I notice is some Oracle kernel modules have been loaded:
[root@server3 ~]# lsmod | grep ora
oracleafd             208499  1
oracleacfs           3307969  0
oracleadvm            506254  0
oracleoks             505749  2 oracleacfs,oracleadvm
I also see that, just like ASMLib, a driver has been plonked into the /opt/oracle/extapi directory:
[root@server3 1]# find /opt/oracle/extapi -ls
2752765    4 drwxr-xr-x   3 root     root         4096 Jul 25 15:15 /opt/oracle/extapi
2752766    4 drwxr-xr-x   3 root     root         4096 Jul 25 15:15 /opt/oracle/extapi/64
2753508    4 drwxr-xr-x   3 root     root         4096 Jul 25 15:15 /opt/oracle/extapi/64/asm
2756532    4 drwxr-xr-x   3 root     root         4096 Jul 25 15:15 /opt/oracle/extapi/64/asm/orcl
2756562    4 drwxr-xr-x   2 root     root         4096 Jul 25 15:15 /opt/oracle/extapi/64/asm/orcl/1
2756578  268 -rwxr-xr-x   1 oracle   dba        272513 Jul 25 15:15 /opt/oracle/extapi/64/asm/orcl/1/libafd12.so
And again, just like ASMLib, there is a new directory under /dev called /dev/oracleafd (whereas for ASMLib it’s called /dev/oracleasm):
[root@server3 ~]# ls -la /dev/oracleafd/
total 0
drwxrwx---  3 oracle dba      80 Jul 25 15:15 .
drwxr-xr-x 21 root   root  15820 Jul 25 15:15 ..
brwxrwx---  1 oracle dba  249, 0 Jul 25 15:15 admin
drwxrwx---  2 oracle dba      40 Jul 25 15:15 disks
The disks directory is currently empty. Maybe I should create some AFD devices and see what happens?
Labelling
So let’s look at my Violin devices and see if I can label them:
root@server3 mapper]# ls -l /dev/mapper
total 0
crw-rw---- 1 root root 10, 236 Jul 11 16:52 control
lrwxrwxrwx 1 root root       7 Jul 25 15:49 data1 -> ../dm-3
lrwxrwxrwx 1 root root       7 Jul 25 15:49 data2 -> ../dm-4
lrwxrwxrwx 1 root root       7 Jul 25 15:49 data3 -> ../dm-5
lrwxrwxrwx 1 root root       7 Jul 25 15:49 data4 -> ../dm-6
lrwxrwxrwx 1 root root       7 Jul 25 15:49 data5 -> ../dm-7
lrwxrwxrwx 1 root root       7 Jul 25 15:49 data6 -> ../dm-8
lrwxrwxrwx 1 root root       7 Jul 25 15:49 data7 -> ../dm-9
lrwxrwxrwx 1 root root       8 Jul 25 15:49 data8 -> ../dm-10
lrwxrwxrwx 1 root root       7 Jul 11 16:53 VolGroup-lv_home -> ../dm-2
lrwxrwxrwx 1 root root       7 Jul 11 16:53 VolGroup-lv_root -> ../dm-0
lrwxrwxrwx 1 root root       7 Jul 11 16:52 VolGroup-lv_swap -> ../dm-1
The documentation appears to be incorrect here, when it says to use the command $ORACLE_HOME/bin/afd_label. It’s actually $ORACLE_HOME/bin/asmcmd with the first parameter afd_label. I’m going to label the devices called /dev/mapper/data*:
[root@server3 mapper]# for lun in 1 2 3 4 5 6 7 8; do
> asmcmd afd_label DATA$lun /dev/mapper/data$lun
> done
Connected to an idle instance.
Connected to an idle instance.
Connected to an idle instance.
Connected to an idle instance.
Connected to an idle instance.
Connected to an idle instance.
Connected to an idle instance.
Connected to an idle instance.

root@server3 mapper]# asmcmd afd_lsdsk
Connected to an idle instance.
--------------------------------------------------------------------------------
Label                     Filtering   Path
================================================================================
DATA1                       ENABLED   /dev/mapper/data1
DATA2                       ENABLED   /dev/mapper/data2
DATA3                       ENABLED   /dev/mapper/data3
DATA4                       ENABLED   /dev/mapper/data4
DATA5                       ENABLED   /dev/mapper/data5
DATA6                       ENABLED   /dev/mapper/data6
DATA7                       ENABLED   /dev/mapper/data7
DATA8                       ENABLED   /dev/mapper/data8
That seemed to work ok. So what’s going on in the /dev/oracleafd/disks directory now?
[root@server3 ~]# ls -l /dev/oracleafd/disks/
total 32
-rw-r--r-- 1 root root 26 Jul 25 15:52 DATA1
-rw-r--r-- 1 root root 26 Jul 25 15:49 DATA2
-rw-r--r-- 1 root root 26 Jul 25 15:49 DATA3
-rw-r--r-- 1 root root 26 Jul 25 15:49 DATA4
-rw-r--r-- 1 root root 26 Jul 25 15:49 DATA5
-rw-r--r-- 1 root root 26 Jul 25 15:49 DATA6
-rw-r--r-- 1 root root 26 Jul 25 15:49 DATA7
-rw-r--r-- 1 root root 26 Jul 25 15:49 DATA8
There they are, just like with ASMLib. But look at the permissions, they are all owned by root with read-only privs for other users. In an ASMLib environment these devices are owned by oracle:dba, which means non-Oracle processes can write to them and corrupt them in some situations. Is this how Oracle claims the AFD protects devices?
I haven’t had time to investigate further but I assume that the database will access the devices via this mysterious block device:
[oracle@server3 oracleafd]$ ls -l /dev/oracleafd/admin
brwxrwx--- 1 oracle dba 249, 0 Jul 25 16:25 /dev/oracleafd/admin
It will be interesting to find out.
Distruction
Of course, if you are logged in as root you aren’t going to be protected from any crazy behaviour:
[root@server3 ~]# cd /dev/oracleafd/disks
[root@server3 disks]# ls -l
total 496
-rw-r--r-- 1 root root 475877 Jul 25 16:40 DATA1
-rw-r--r-- 1 root root     26 Jul 25 15:49 DATA2
-rw-r--r-- 1 root root     26 Jul 25 15:49 DATA3
-rw-r--r-- 1 root root     26 Jul 25 15:49 DATA4
-rw-r--r-- 1 root root     26 Jul 25 15:49 DATA5
-rw-r--r-- 1 root root     26 Jul 25 15:49 DATA6
-rw-r--r-- 1 root root     26 Jul 25 15:49 DATA7
-rw-r--r-- 1 root root     26 Jul 25 15:49 DATA8
[root@server3 disks]# od -c -N 256 DATA8
0000000   /   d   e   v   /   m   a   p   p   e   r   /   d   a   t   a
0000020   8  \n
0000032
[root@server3 disks]# dmesg >> DATA8
[root@server3 disks]# od -c -N 256 DATA8
0000000   /   d   e   v   /   m   a   p   p   e   r   /   d   a   t   a
0000020   8   \n   z   r   d   b   t   e   2  l   I   n   i   t   i   a
0000040   l   i   z   i   n   g       c   g   r   o   u   p       s   u
0000060   b   s   y   s       c   p   u   s   e   t  \n   I   n   i   t
0000100   i   a   l   i   z   i   n   g       c   g   r   o   u   p
0000120   s   u   b   s   y   s       c   p   u  \n   L   i   n   u   x
0000140       v   e   r   s   i   o   n       3   .   8   .   1   3   -
0000160   2   6   .   2   .   3   .   e   l   6   u   e   k   .   x   8
0000200   6   _   6   4       (   m   o   c   k   b   u   i   l   d   @
0000220   c   a   -   b   u   i   l   d   4   4   .   u   s   .   o   r
0000240   a   c   l   e   .   c   o   m   )       (   g   c   c       v
0000260   e   r   s   i   o   n       4   .   4   .   7       2   0   1
0000300   2   0   3   1   3       (   R   e   d       H   a   t       4
0000320   .   4   .   7   -   3   )       (   G   C   C   )       )
0000340   #   2       S   M   P       W   e   d       A   p   r       1
0000360   6       0   2   :   5   1   :   1   0       P   D   T       2
0000400
Proof, if ever you need it, that root access is still the fastest and easiest route to total disaster…
[Update July 2015: Ok, so look. I was wrong in this post – these /dev/oracleafd/disks devices are simply pointers to devices in /dev/dm-* and thus I was only overwriting the pointer. To read a more accurate post on the subject, please read here]
New AWR Report Format: Oracle 11.2.0.4 and 12c
This is a post about Oracle Automatic Workload Repository (AWR) Reports. If you are an Oracle professional you doubtless know what these are – and if you have to perform any sort of performance tuning as part of your day job it’s likely you spend a lot of time immersed in them. Goodness knows I do – a few weeks ago I had to analyse 2,304 of them in one (long) day. But for anyone else, they are (huge) reports containing all sorts of information about activities that happened between two points of time on an Oracle instance. If that doesn’t excite you now, please move along – there is nothing further for you here.
 AWR Reports have been with us since the introduction of the Automatic Workload Repository back in 10g and can be considered a replacement for the venerable Statspack tool. Through each major incremental release the amount of information contained in an AWR Report has grown; for instance, the 10g reports didn’t even show the type of operating system, but 11g reports do. More information is of course a good thing, but sometimes it feels like there is so much data now it’s hard to find the truth hidden among all the distractions.
I recently commented in another post about the change in AWR report format introduced in 11.2.0.4. This came as a surprise to me because I cannot previously remember report formatting changing mid-release, especially given the scale of the change. Not only that, but I’m sure I’ve seen reports from 11.2.0.3 in the new format too (implying it was added via a patch set update), although I can’t find the evidence now so am forced to concede I may have imagined it. The same new format also continues into 12.1.0.1 incidentally.
The 11.2.0.4 New Features document doesn’t mention anything about a new report format. I can’t find anything about it on My Oracle Support (but then I can never find anything about anything I’m looking for on MOS these days). So I’m taking it upon myself to document the new format and the changes introduced – as well as point out a nasty little issue that’s caught me out a couple of times already.
Comparing Old and New Formats
From what I can tell, all of the major changes except one have taken place in the Report Summary section at the start of the AWR report. Oracle appears to have re-ordered the subsections and added a couple of new ones:
- Wait Classes by Total Wait Time
- IO Profile
The new Wait Classes section is interesting because there is already a section called Foreground Wait Class down in the Wait Event Statistics section of the Main Report, but the additional section appears to include background waits as well. The IO Profile section is especially useful for people like me who work with storage – and I’ve already blogged about it here.
In addition, the long-serving Top 5 Timed Foreground Events section has been renamed and extended to become Top 10 Foreground Events by Total Wait Time.
Here are the changes in tabular format:
|
Old Format |
New Format |
|
Cache Sizes Load Profile Instance Efficiency Percentages Shared Pool Statistics Top 5 Timed Foreground Events Host CPU Instance CPU Memory Statistics – – Time Model Statistics |
Load Profile Instance Efficiency Percentages Top 10 Foreground Events by Total Wait Time Wait Classes by Total Wait Time Host CPU Instance CPU IO Profile Memory Statistics Cache Sizes Shared Pool Statistics Time Model Statistics |
I also said there was one further change outside of the Report Summary section. It’s the long-standing Instance Activity Stats section, which has now been divided into two:
|
Old Format |
New Format |
|
Instance Activity Stats – |
Key Instance Activity Stats Other Instance Activity Stats |
I don’t really understand the point of that change, nor why a select few statistics are deemed to be more “key” than others. But hey, that’s the mystery of Oracle, right?
Tablespace / Filesystem IO Stats
Another, more minor change, is the addition of some cryptic-looking “1-bk” columns to the two sections Tablespace IO Stats and File IO Stats:
Tablespace
------------------------------
          Av       Av     Av      1-bk  Av 1-bk          Writes   Buffer  Av Buf
  Reads   Rds/s  Rd(ms) Blks/Rd   Rds/s  Rd(ms)  Writes   avg/s    Waits  Wt(ms)
------- ------- ------- ------- ------- ------- ------- ------- -------- -------
UNDOTBS1
8.4E+05      29     0.7     1.0 6.3E+06    29.2       1     220    1,054     4.2
SYSAUX
 95,054       3     0.8     1.0  11,893     3.3       1       0        1    60.0
SYSTEM
    745       0     0.0     1.0   1,055     0.0       0       0       13     0.8
USERS
    715       0     0.0     1.0     715     0.0       0       0        0     0.0
TEMP
      0       0     0.0     N/A       7     0.0       0       0        0     0.0
I have to confess it took me a while to figure out what they meant – in the end I had to consult the documentation for the view DBA_HIST_FILESTATXS:
| Column | Datatype | NULL | Description |
|---|---|---|---|
SINGLEBLKRDS |
NUMBER |
Number of single block reads | |
SINGLEBLKRDTIM |
NUMBER |
Cumulative single block read time (in hundredths of a second) |
Aha! So the AWR report is now giving us the number of single block reads (SINGLEBLKRDS) and the average read time for them (SINGLEBLKRDTIM / SINGLEBLKRDS). That’s actually pretty useful information for testing storage, since single block reads tell no lies. [If you want to know what I mean by that, visit Frits Hoogland’s blog and download his white paper on multiblock reads…]
Top 10: Don’t Believe The Stats
One thing you might want to be wary about is the new Top 10 section… Here are the first two lines from mine after running a SLOB test:
Top 10 Foreground Events by Total Wait Time
~~~~~~~~~~~~~~~~~~~~~~~~~~~~~~~~~~~~~~~~~~~
                                            Tota    Wait   % DB
Event                                 Waits Time Avg(ms)   time Wait Class
------------------------------ ------------ ---- ------- ------ ----------
db file sequential read        3.379077E+09 2527       1   91.4 User I/O
DB CPU                                      318.           11.5
Now, normally when I run SLOB and inspect the post-run awr.txt file I work out the average wait time for db file sequential read so I can work out the latency. Since AWR reports do not have enough decimal places for the sort of storage I use (the wait shows simply as 0 or 1), I have to divide the total wait time by the number of waits. But in the report above, the total wait time of 2,527 divided by 3,379,077,000 waits gives me an average of 0.000747 microseconds. Huh? Looking back at the numbers above it’s clear that the Total Time column has been truncated and some of the digits are missing. That’s bad news for me, as I regularly use scripts to strip this information out and parse it.
This is pretty poor in my opinion, because there is no warning and the number is just wrong. I assume this is an edge case because the number of waits contains so many digits, but for extended SLOB tests that’s not unlikely. Back in the good old Top 5 days it looked like this, which worked fine:
Top 5 Timed Foreground Events
~~~~~~~~~~~~~~~~~~~~~~~~~~~~~                              Avg
                                                          wait   % DB
Event                                 Waits     Time(s)   (ms)   time Wait Class
------------------------------ ------------ ----------- ------ ------ ----------
db file sequential read         119,835,425      50,938      0   84.0 User I/O
latch: cache buffers lru chain   20,051,266       6,221      0   10.3 Other
Unfortunately, in the new 11.2.0.4 and above Top 10 report, the Total Time column simply isn’t wide enough. Instead, I have to scan down to the Foreground Wait Events section to get my true data:
                                                             Avg
                                        %Time Total Wait    wait    Waits   % DB
Event                             Waits -outs   Time (s)    (ms)     /txn   time
-------------------------- ------------ ----- ---------- ------- -------- ------
db file sequential read    3.379077E+09     0  2,527,552       1     11.3   91.4
This is something worth looking out for, especially if you also use scripts to fetch data from AWR files. Of course, the HTML reports don’t suffer from this problem, which just makes it even more annoying as I can’t parse HTML reports automatically (and thus I despise them immensely).
12.1.0.2 AWR Reports
One final thing to mention is the AWR report format of 12.1.0.2 (which was just released at the time of writing). There aren’t many changes from 12.1.0.1 but just a few extra lines have crept in, which I’ll highlight here. In the main, they are related to the new In Memory Database option.
Load Profile                    Per Second   Per Transaction  Per Exec  Per Call
~~~~~~~~~~~~~~~            ---------------   --------------- --------- ---------
             DB Time(s):               0.3               4.8      0.00      0.02
              DB CPU(s):               0.1               1.2      0.00      0.00
      Background CPU(s):               0.0               0.1      0.00      0.00
      Redo size (bytes):          50,171.6         971,322.7
  Logical read (blocks):             558.6          10,814.3
          Block changes:             152.2           2,947.0
 Physical read (blocks):              15.1             292.0
Physical write (blocks):               0.2               4.7
       Read IO requests:              15.1             292.0
      Write IO requests:               0.2               3.3
           Read IO (MB):               0.1               2.3
          Write IO (MB):               0.0               0.0
           IM scan rows:               0.0               0.0
Session Logical Read IM:
             User calls:              16.1             312.0
           Parses (SQL):              34.0             658.0
      Hard parses (SQL):               4.6              88.0
     SQL Work Area (MB):               0.9              17.2
                 Logons:               0.1               1.7
         Executes (SQL):              95.4           1,846.0
              Rollbacks:               0.0               0.0
           Transactions:               0.1

Instance Efficiency Percentages (Target 100%)
~~~~~~~~~~~~~~~~~~~~~~~~~~~~~~~~~~~~~~~~~~~~~
            Buffer Nowait %:   97.55       Redo NoWait %:  100.00
            Buffer  Hit   %:   97.30    In-memory Sort %:  100.00
            Library Hit   %:   81.75        Soft Parse %:   86.63
         Execute to Parse %:   64.36         Latch Hit %:   96.54
Parse CPU to Parse Elapsd %:   19.45     % Non-Parse CPU:   31.02
          Flash Cache Hit %:    0.00

<snip!>

Cache Sizes                       Begin        End
~~~~~~~~~~~                  ---------- ----------
               Buffer Cache:       960M       960M  Std Block Size:         8K
           Shared Pool Size:     4,096M     4,096M      Log Buffer:   139,980K
             In-Memory Area:         0M         0M
One other thing of note is that the Top 10 section now (finally) displays average wait times to two decimal places. This took a surprising amount of time to arrive, but it’s most welcome:
Top 10 Foreground Events by Total Wait Time
~~~~~~~~~~~~~~~~~~~~~~~~~~~~~~~~~~~~~~~~~~~
                                           Total Wait       Wait   % DB Wait
Event                                Waits Time (sec)    Avg(ms)   time Class
------------------------------ ----------- ---------- ---------- ------ --------
db file parallel read               63,157      828.6      13.12   86.1 User I/O
DB CPU                                          234.2              24.3
db file sequential read            113,786       67.8       0.60    7.0 User I/O
New section: Oracle SLOB Testing

For some time now I have preferred Oracle SLOB as my tool for generating I/O workloads using Oracle databases. I’ve previously blogged some information on how to use SLOB for PIO testing, as well as shared some scripts for running tests and extracting results. I’ve now added a whole new landing page for SLOB and a complete guide to running sustained throughput testing.
Why would you want to run sustained throughput tests? Well, one great reason is that not all storage platforms can cope with sustained levels of write workload. Flash arrays, or any storage array which contains flash, have a tendency to suffer from garbage collection issues when sustained write workloads hit them hard enough.
Find out more by following the links below:
New My Oracle Support note on Advanced Format (4k) storage
![]()
In the past I have been a little critical of Oracle’s support notes and documentation regarding the use of Advanced Format 4k storage devices. I must now take that back, as my new friends in Oracle ASM Development and Product Management very kindly offered to let me write a new support note, which they have just published on My Oracle Support. It’s only supposed to be high level, but it does confirm that the _DISK_SECTOR_SIZE_OVERRIDE parameter can be safely set in database instances when using 512e storage and attempting to create 4k online redo logs.
The new support note is:
Using 4k Redo Logs on Flash and SSD-based Storage (Doc ID 1681266.1)
Don’t forget that you can read all about the basics of using Oracle with 4k sector storage here. And if you really feel up to it, I have a 4k deep dive page here.
Oracle SLOB On Solaris
Guest Post
This is another guest post from my buddy Nate Fuzi, who performs the same role as me for Violin but is based in the US instead of EMEA. Nate believes that all English people live in the Dickensian London of the 19th century and speak in Cockney rhyming slang. I hate to disappoint, so have a butcher’s below and feast your mince pies on his attempts to make SLOB work on Solaris without going chicken oriental. Over to you Nate, me old china plate.

Note: The Silly Little Oracle Benchmark, or SLOB, is a Linux-only tool designed and released for the community by Kevin Closson. There are no ports for other operating systems – and Kevin has always advised that the solution for testing on another platform is to use a Linux VM and connect via TNS. The purpose of this post is simply to show what happens when you have no other choice but to try and get SLOB working natively on Solaris…
I wrestled with SLOB 2 for a couple hours last week for a demo build we had in-house to show our capabilities to a prospective customer. I should mention I’ve had great success—and ease!—with SLOB 2 previously. But that was on Linux. This was on Solaris 10—to mimic the setup the customer has in-house. No problem, I thought; there’s some C files to compile, but then there’s just shell scripts to drive the thing. What could go wrong?
Well, it would seem Kevin Closson, the creator of SLOB and SLOB 2, did his development on an OS with a better sense of humor than Solaris. The package unzipped, and the setup.sh script appeared to run successfully, but runit.sh would load up the worker threads and wait several seconds before launching them—and then immediately call it “done” and bail out, having executed on the database only a couple seconds. Huh? I had my slob.conf set to execute for 300 seconds.
I had two databases created: one with 4K blocks and one with 8K blocks. I had a tablespace created for SLOB data called SLOB4K and SLOB8K, respectively. I ran setup.sh SLOB4K 128, and the log file showed no errors. All good, I thought. Now run runit.sh 12, and it stops as quickly as it starts. Oof.
It took Bryan Wood, a much better shell script debugger (hey, I said DEbugger) than myself, to figure out all the problems.
First, there was this interesting line of output from the runit.sh command:
NOTIFY: Connecting users 1 2 3 Usage: mpstat [-aq] [-p | -P processor_set] [interval [count]]
4 5 6 7 8 9 10
Seems Solaris doesn’t like mpstat –P ALL. However it seems that on Solaris 10 the mpstat command shows all processors even without the -P option.
Next, Solaris doesn’t like Kevin’s “sleep .5” command inside runit.sh; it wants whole numbers only. That raises the question in my mind why he felt the need to check for running processes every half second rather than just letting it wait a full second between checks, but fine. Modify the command in the wait_pids() function to sleep for a full second, and that part is happy.
But it still kicks out immediately and kills the OS level monitoring commands, even though there are active SQL*Plus sessions out there. It seems on Solaris the ps –p command to report status on a list of processes requires the list of process IDs to be escaped where Linux does not. IE:
-bash-3.2$ ps -p 1 2 3
usage: ps [ -aAdeflcjLPyZ ] [ -o format ] [ -t termlist ]
        [ -u userlist ] [ -U userlist ] [ -G grouplist ]
        [ -p proclist ] [ -g pgrplist ] [ -s sidlist ] [ -z zonelist ]
  'format' is one or more of:
        user ruser group rgroup uid ruid gid rgid pid ppid pgid sid taskid ctid
        pri opri pcpu pmem vsz rss osz nice class time etime stime zone zoneid
        f s c lwp nlwp psr tty addr wchan fname comm args projid project pset
But with quotes:
-bash-3.2$ ps -p "1 2 3"
   PID TTY         TIME CMD
     1 ?           0:02 init
     2 ?           0:00 pageout
     3 ?          25:03 fsflush
After some messing about, Bryan had the great idea to simply replace the command:
while ( ps -p $pids > /dev/null 2>&1 )
With:
while ( ps -p "$pids" > /dev/null 2>&1 )
Just thought I might save someone else some time and hair pulling by sharing this info… Here are the finished file diffs:
-bash-3.2$ diff runit.sh runit.sh.original
31c30
< while ( ps -p "$pids" > /dev/null 2>&1 )
---
> while ( ps -p $pids > /dev/null 2>&1 )
33c32
<       sleep 1
---
>       sleep .5
219c218
<       ( mpstat 3  > mpstat.out ) &
---
>       ( mpstat -P ALL 3  > mpstat.out ) &
