 Working for Kaminario means I get to play with a lot of high performance storage. This is a Good Thing. But with so much cool stuff available to mess around with, how do I go about differentiating the various products and versions in my lab? For example, if I get hold of a new Kaminario all flash array, how hard can I drive it using Oracle? There are many load generation and benchmarking tools available out there, but I’m not interested in raw I/O performance – I can get that from the datasheet. I want to view the array through the lens of an Oracle database instance.
Even more importantly, I want to test the differences in performance as I change various parts of the equation: operating system, kernel, multipathing parameters, UDEV parameters, ASM configuration… What simple but effective tool can I use for this? Why I’m glad you asked. It’s the Silly Little Oracle Benchmark, also known as SLOB – and you can check here for the latest release.
I’m not going to explain any more about SLOB here, because that task has already been performed by Kevin. If you don’t already know what SLOB is, I highly recommend testing it out. You can find a master page about SLOB on Kevin’s site here and my own SLOB master page here.
PIO Testing
The reason I like SLOB is that I can use it to test physical I/O. I can run SLOB with a defined set of workers and then use the resultant AWR report to calculate the number of read/write IOPS and the average latency of those reads/writes. I can also set parameters to modify the percentage of calls which are modify DML and the elapsed time for each test. This allows me to create graphs of the target system’s performance characteristics.
To use SLOB for testing Oracle with physical I/O you must first ensure that a large enough portion of its I/O requests are not being satisfied by the Oracle database buffer cache. This either means making the buffer cache very small or making the SLOB working data set sufficiently large.
In the past I opted for the approach of using a small buffer cache, but this became tricky when the database server had a high number of CPU cores, as it affected the minimum possible buffer cache size. Now I prefer the option of using a larger working set, which is very easy to configure with the SLOB setup script.
SLOB Parameters
My advice when using a parameter file for SLOB is to Keep It Simple.ora Stupid. I used to have my own parameter files but the simple.ora file which comes packaged in the SLOB2 tarball is perfect. It only requires you to modify two parameters, which are shown at the top of the file:
#set the following to paths that make sense on your system:
db_create_file_dest = '/data'
control_files=('/data/cntrlSLOB.dbf')
The DB_CREATE_FILE_DEST parameter should be modified to the location where your database files will reside (almost always an ASM diskgroup in my case), while the CONTROL_FILES parameter should match the location of the control files in your database. You may also find you need to add a COMPATIBLE parameter, but that’s not particularly onerous.
If you are curious about the underscore parameters lower down in the simple.ora file then you need to read this blog post by Yury.
SLOB2 Harness
When I have SLOB configured ready to go, I want to run a series of SLOB tests and record the results. What I want to see is the affect of running consecutive tests but with the number of workers steadily increasing from 1 up to 256 – I can then plot the output on a graph of latency versus IOPS. I also want to repeat this set of tests with varying ratios of reads to writes, i.e. by changing the UPDATE_PCT value in SLOB to trigger a certain proportion of UPDATE statements.
For this purpose I created a “SLOB Harness” script to run call SLOB using parameters fed from a configuration file. You can find both the shell script and a sample configuration file here:
I should point out that this script is hardly the best piece of coding I’ve ever created. It was something that developed organically without me ever finding the time to go back and clean it up to make it presentable. I originally intended to spend more time on it but realised that this might never happen. In the meantime, someone who shall remain nameless applied some gentle pressure to get it out into the community. So here it is!
What To Do
This is the process I follow:
- Build database “orcl” using DBCA or tool of preference. Alternatively use SLOB’s create_database_kit (in the misc directory)
- Ensure the redo logs are large enough (I use something like 5 log groups with members 1GB each. You may also need to use a 4k blocksize for the redo logs if your storage is 4k-based)
- Create a tablespace called IOPS size 2TB (capacity is not an issue when you work for a storage vendor!)
- Extract SLOB into ~oracle/SLOB, change directory to ./wait_kit and execute: make all
- Install SLOB into database using: ./setup.sh IOPS 256
- Disable the scheduler and resource manager so they don’t interfere (see note 786346.1)
- If using 11.2.0.4, run the 11204-awr-stall-fix.sql script found in the awr directory
- Edit the simple.ora in the SLOB directory to use correct control_files and db_create_file_dest parameters (and possibly the compatible parameter)
- Restart database using pfile=simple.ora
- Add the slob2-harness.sh and slob2-harness.inf files to the SLOB directory and make the .sh file executable. Examine the .inf file to ensure you are happy with the test criteria
- Run slob harness: nohup ./slob2-harness.sh > slob2-harness.out 2>&1 &
- Wait a long time (many hours) until job completes. Tail the output file to see the percentage completion (if you use the default slob.conf settings each test will take 5 minutes): tail -100f slob2-harness.out
- Create CSV file using slob2-analyze.sh (see next section)
SLOB2 Analyze
Once the harness has completed you will be left with a large number of AWR reports in the form of text files. What do you want to do with them? In my case, I want to parse them all to read the number of IOPS (the “Physical reads” and “Physical writes” values). I then want to calculate the latency. Unfortunately, in AWR reports Oracle only calculates the average wait time in milliseconds – and for flash storage this often means a value of zero. So instead, I need to manually calculate the average latency by dividing the values for total time waited by the number of waits:
Top 5 Timed Foreground Events
~~~~~~~~~~~~~~~~~~~~~~~~~~~~~
                                                           Avg
                                                          wait   % DB
Event                                 Waits     Time(s)   (ms)   time Wait Class
------------------------------ ------------ ----------- ------ ------ ----------
db file sequential read         119,835,425      50,938      0   84.0 User I/O
So here, for example, I want to calculate the random read latency (hence I am looking at the wait event for db file sequential read. The AWR report shows an average wait of 0ms (thanks Oracle), but if I divide the total time (shown in blue) by the number of waits (shown in red) I get a value of 0.000425 seconds, which (multiplying by one million) translates into 425 microseconds.
I’m also interested in the number of IOPS and average latency for writes from the database buffer (db file parallel write) as well as redo writes (log file parallel write). Calculating these values by hand for each file is a pain, so again I wrote a shell script to spit the values out for me. In the spirit of sharing I’ll also post this here:
This is a fairly straightforward script which parses AWR files using sed and grep to get the required values. It’s not elegant – for anything more serious I would recommend by AWR Parser script instead – but it does the job. The output is a CSV file which can be loaded into spreadsheet software such as Microsoft Excel. It’s also not RAC aware – again, if you want to do anything more complicated you need to use the AWR Parser. [Alternatively, Jeff Moss has a RAC version of SLOB2-Analyze on his site]
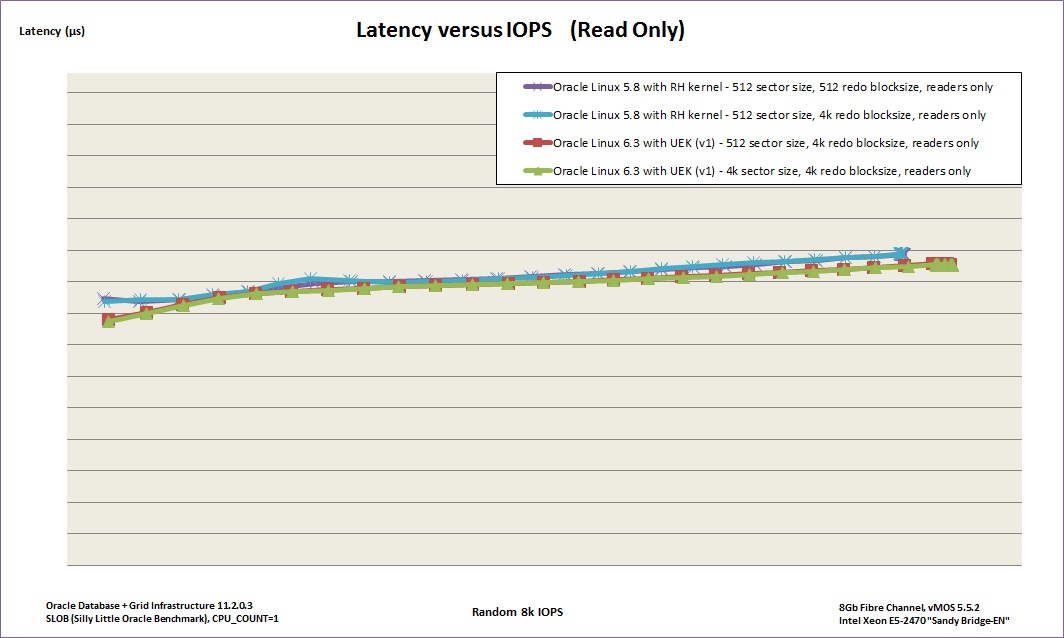
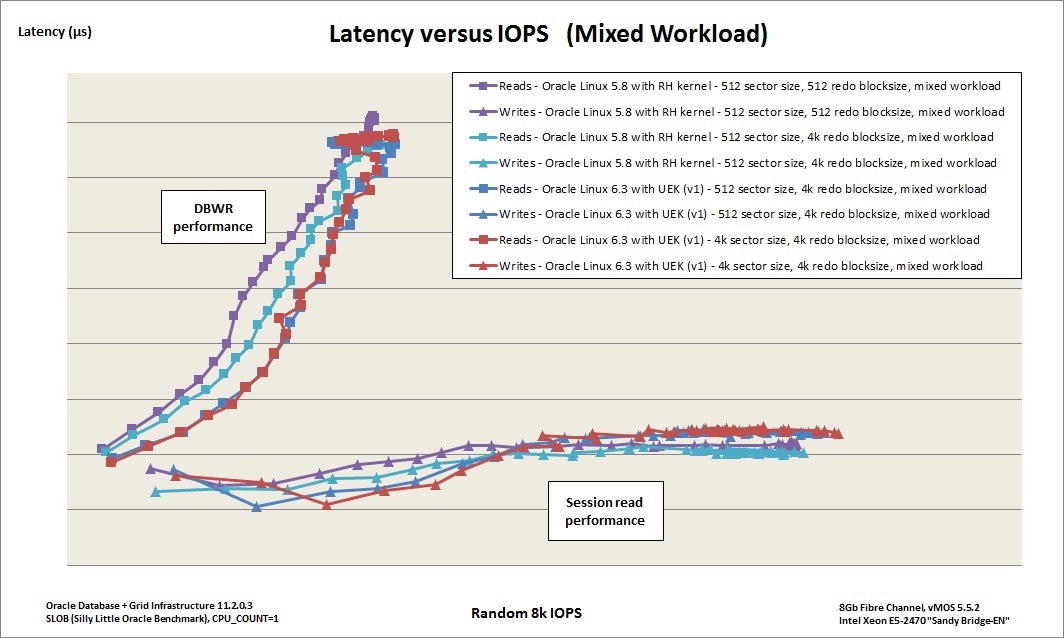
Once you have the date in a spreadsheet you can do what you want with it – I like to graph latency versus IOPS and plot lines for various combinations of operating systems, kernels etc to see what gives the best performance. Here are some examples to get you in the mood:
Read Only Workload
Mixed Workload


How do I run SLOB2 for a specified amount of time (say a few hours) for a specified update percentage (say 20%)? I have tried setting 3600 for “RUN_TIME” and 30 for UPDATE_PCT. The run completes in about 1800 seconds instead of specified 3600 seconds. If I kick off a subsequent run keeping RUN_TIME and UPDATE_PCT setting the same in slob.conf file, the test runs randomly end within a few seconds (sometimes 5 seconds, sometimes 8 etc.). Thank you. – Saad
I’m afraid this sounds like a problem with your environment, because that behaviour is not normal. You would need to debug it and check the log files. If you are using the test harness you can use the -v flag to print verbose output. If you need more output you can use the hidden -X flag, but beware this creates a LOT of output.