 Storage For DBAs: Everyone wants their stuff to go faster. Whether it’s your laptop, tablet, phone, database or application… performance is one of the most desirable characteristics of any system. If your system isn’t fast enough, you start dreaming of more. Maybe you try and tune what you already have, or maybe you upgrade to something better: you buy a phone with a faster processor, or stick an SSD in your laptop… or uninstall Windows 🙂
When it comes to databases, I often find people considering the same set of options for boosting performance (usually in this order): half-heartedly tuning the database, adding more DRAM, *properly* tuning the database, adding or upgrading CPUs, then finally tuning the application. It amazes me how much time, money and effort is often spent trying to avoid getting the application developers to write their code properly, but that’s a subject for another blog.
The point of this blog is the following statement: to achieve the best performance on any system it is important that all of its resources are balanced.
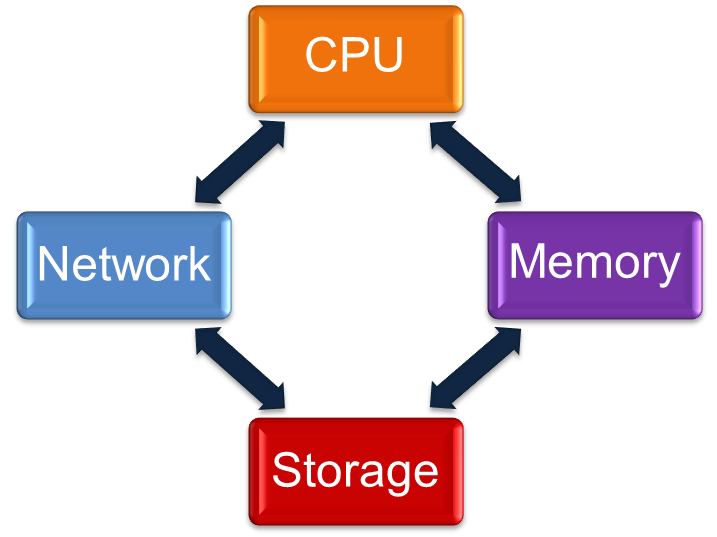
Let’s think about the basic resources that comprise a computer system such as a database server:
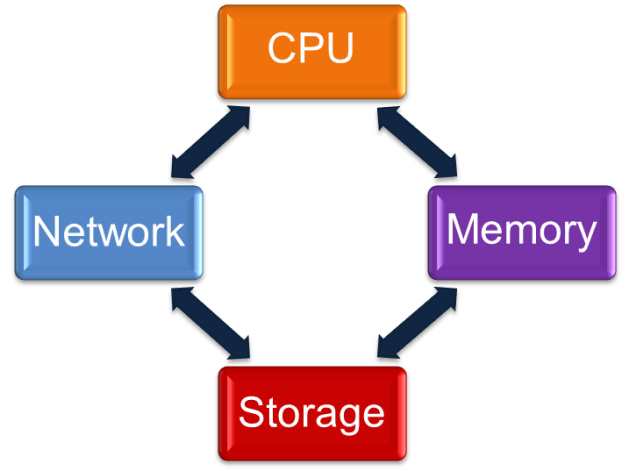
- CPU – the processor, i.e. the thing that actually does the work. Every process pretty much exists to take some input, get on CPU, perform some calculations and produce some output. It’s no exaggeration to call this the heart of the system.
- Network – communications with the outside world, whether it be the users, the application servers or other databases.
- Memory – Dynamic Random Access Memory (DRAM) provides a store for data.
- Storage – for example disk or flash; provides a store for data.
You’ll notice I’ve been a bit disingenuous by describing Memory and Storage the same way, but I want to make a point: both Memory and Storage are there to store data. Why have two different resources for what is essentially the same purpose?
The answer, which you obviously already know, is that DRAM is volatile (i.e. continuous power is required to maintain the stored information, otherwise it is lost) while Storage is persistent (i.e. the stored information remains in place until it is actively changed or removed).
When you think about it like that, the Storage resource has a big advantage over the Memory resource, because the data you are storing is safe from unexpected power loss. So why do we have the DRAM? What does it bring to the party? And why do I keep asking you questions you already know the answer to?
Ok I’ll get to the point, which is this: DRAM is used to drive up CPU utilisation.
The Long Walk
 The CPU is interacting with the Memory and Storage resources by sending or requesting data. Each request takes a certain amount of time – and that time can vary depending on factors such as the amount of data and whether the resource is busy. But let’s ignore all that for now and just consider the minimum possible time taken to send or receive that data: the latency. CPUs have clock cycles, which you can consider a metronome keeping the beat to which everything else must dance. That’s a gross simplification which may make some people wince (read here if you want to know why), but I’m going to stick with it for the sake of clarity.
Let’s consider a 2GHz processor – by no means the fastest available clock speed out there today. The 2GHz indicates that the clock cycle is oscillating 2 billion times per second. That means one oscillation every half a nanosecond, which is such a tiny amount of time that we can’t really comprehend it, so instead I’m going to translate it into the act of walking, where each single pace is a clock cycle. With each step taken, an instruction can be executed, so:
One CPU Cycle = Walking 1 Pace
The current generation of DRAM is DDR3 DRAM, which has latencies of around 10 nanoseconds. So now, while walking along, if you want to access data in DRAM you need to incur a penalty of 20 paces where you potentially cannot do anything else.
Accessing DRAM = Walking 20 Paces
Now let’s consider storage – and in particular, our old friend the disk drive. I frequently see horrible latency problems with disk arrays (I guess it goes with the job) but I’ll be kind here and choose a latency of 5 milliseconds, which on a relatively busy system wouldn’t be too bad. 5 milliseconds is of course 5 million nanoseconds, which in our analogy is 10 million steps. According to the American College of Sports Medicine there are an average of 2,000 steps in one mile. So now, walking along and making an I/O request to disk incurs a penalty of 10,000,000 steps or 5,000 miles. Or, to put it another way:
Accessing Disk = Walking from London to San Francisco
Take a minute to consider the impact. Previously you were able to execute an instruction every step, but now you need to walk a fifth of the way around the planet before you can continue working. That’s going to impact your ability to get stuff done.
Maybe you think 5 milliseconds is high for disk latency (or maybe you think anyone walking from London to San Francisco might face some ocean-based issues) but you can see that the numbers easily translate: every millisecond of latency is equivalent to walking one thousand miles.
Don’t forget what that means back in the real world: it translates to your processor sitting there not doing anything because it’s waiting on I/O. Increasing the speed of that processor only increases the amount of work it’s unable to do during that wait time. If you didn’t have DRAM as a “temporary” store for data, how would you ever manage to do any work? No wonder In-Memory technologies are so popular these days.
Moore’s Law Isn’t Helping
 It’s often stated or inferred that Moore’s Law is bringing us faster processors every couple of years, when in fact the original statement was on doubling the number of transistors on an integrated circuit. But the underlying point remains that processor performance is increasing all the time. Looking at the four resources we outlined above, you could say that in a similar way DRAM technologies are progressing while network protocols are getting faster (10Gb Ethernet is commonplace, Infiniband is increasingly prevalent and 40Gb or 100Gb Ethernet is not far away).
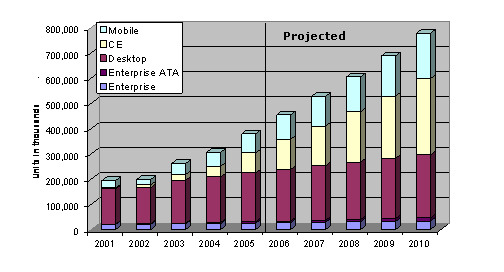
On the other hand, disk performance has been stationary for years. According to this manual from Seagate the performance of CPUs increased 2,000,000x between 1987 and 2004 yet the performance of hard disk drives only increased 11x. That’s hardly surprising – how many years ago did the 15k RPM disk drive come out? We’re still waiting for something faster but the manufacturers have hit the limits of physics. The idea of helium-filled drives has been floated (sorry, couldn’t resist) and indeed they could be on the shelves soon, but if you ask me the whole concept is so up-in-the-air (sorry, I really can’t help it) that I have serious doubts whether it will actually take off (ok I promise that’s the last one).
The consequence of Moore’s Law is that the imbalance between disk storage and the other resources such as CPU is getting worse all the time. If you have performance issues caused by this imbalance – and then move to a newer, faster server with more processing power… the imbalance will only get worse.
The Silicon Data Centre
 Disk, as a consequence of its mechanical nature, cannot keep up with silicon as the number of transistors on a processor doubles every two years. Well as the saying goes, if you can’t beat them, join them. So why not put your persistent data store on silicon?
This is the basis of the argument for moving to flash memory: it’s silicon-based. The actual technology most vendors are using is NAND flash but that’s not massively important and technologies will come and go. The important point is to get storage onto the graph of Moore’s Law. Going back to the walking analogy above, an I/O to flash memory takes in the region of 200 microseconds, i.e. 200 thousand nanoseconds. This is a number of orders of magnitude faster than disk but still represents walking 400,000 paces or 200 miles. But unlike disk, the performance is getting better. And by moving storage to silicon we also pick up many other benefits such as reduced power consumption, space and cooling requirements. And most importantly we restore some balance to your server infrastructure.
Think about it. You have to admit that, as an argument, it’s pretty well balanced.
Footnote: Yes I know that by representing CPU clock cycles as instructions I am contributing to the Megahertz Myth. Sorry about that. Also, I strongly advise reading this article in the NoCOUG journal which makes some great points about DRAM and CPU utilisation. My favourite quote is, “Idle processors do not speed up database processing!” which is so obvious and yet so often overlooked.
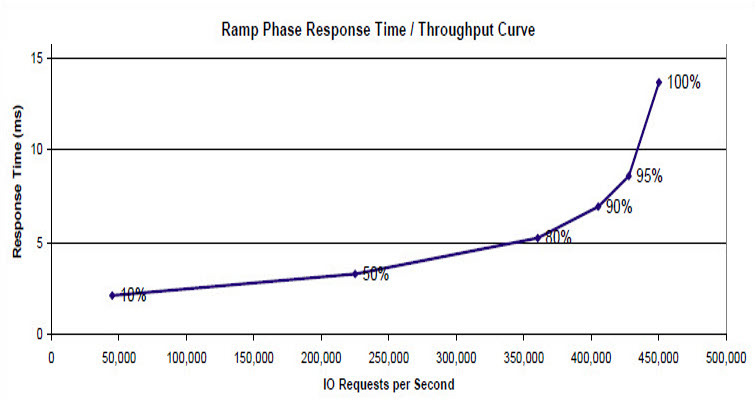
 I ran some SLOB tests over the weekend using the new SLOBv2 kit and noticed some interesting results. I was using SLOB to generate physical I/O but the “anomaly” is best demonstrated by putting SLOB in “Logical I/O mode”, i.e. by having a large enough buffer cache to satisfy all reads.