Storage Myths: IOPS Matter

shout-iops

Storage for DBAs: Having now spent over a year in the storage industry, I’ve decided it’s time to call out an industry-wide obsession that I previously wasn’t aware of: everyone in storage is obsessed with IOPS (the performance metric I/O Operations Per Second). Take a minute to perform a web search for “flash iops” and you’ll see countless headlines from vendors that have broken new IOPS records – and yes, these days my own employer is often one of them. You’d be forgiven for thinking that, in storage, IOPS was the most important thing ever.

I’m here to tell you that it isn’t. At least, not if databases are your game.

storage-characteristicsFundamental Characteristics of Storage

In a previous article I described the three fundamental characteristics of storage: latency, IOPS and bandwidth (or throughput). I even drew a simple, boxy diagram which, despite being one of the least-inspiring pieces of artwork ever created, serves me well enough to warrant its inclusion again here. These three properties are related – when one changes, the others change. With that in mind, here’s lesson #1:

High numbers of IOPS are useless unless they are delivered at low latency.

It’s all very well saying you can supply 1 million, 2 million, 4 million IOPS but if the latency sucks it’s not going to be of much value in the real world. Flash is great for delivering higher numbers of IOPS than disk, particularly for random I/Os (as I’ve written about previously), but ultimately the delay introduced by high latency is going to make real-world workloads unusable.

And there’s another, oft-hidden, problem that many flash vendors face: unpredictable latency. This is particularly the case during write-heavy workloads where garbage collection cannot always keep up with load, resulting in the infamous “write cliff” (more technically described as bandwidth degradationsee figure 7 of this paper). Maybe we should revise that previous line to be lesson #1.5;

High numbers of IOPS are useless unless they are delivered at predictable low latency.

But what about when we deal with volumes of data? If your requirement is to process vast amounts of information, do IOPS then become more important? Not really, because this is a bandwidth challenge – you need to design and build a system to suit your bandwidth requirements. How many GB/sec do you need? What can the storage subsystem deliver and how fast can you process it? Unlike bandwidth, an IOPS measurement does not contain the critical component of block size, so information is missing. And if you have the bandwidth figures, there is little additional value in knowing the IOPS, is there? Cue lesson #2:

Bandwidth figures are more useful for describing data volumes than IOPS

So what good are IOPS figures? And why does the storage industry talk about them all the time? Personally I think it’s a hang-up from the days of disk, when IOPS were such a limiting factor… and partly a marketing thing, because multi-million results sound impressive. Who knows? I’m more interested in what we should be asking about than what we shouldn’t.

So what does matter?

Latency Is King

crown-latencyForget everything else. Latency is the critical factor because this is what injects delay into your system. Latency means lost time; time that could have been spent busily producing results, but is instead spent waiting for I/O resources.
Forget IOPS. The whole point of a flash array is that IOPS effectively become an unlimited resource. Sure, there is always a real limit – but it’s so high that it’s no longer necessary to worry about it.

Bandwidth still matters, particularly when you are doing something which requires volume, such as analytics or data warehousing. But bandwidth is a question of plumbing – designing a solution with enough capability to deliver throughout the stack: storage, fabric, HBAs, network, processor… build it and the data will come.

Latency is the “application stealth tax”, extending the elapsed times of individual tasks and processes until everything takes slightly longer. Add up all those delays and you have a significant problem. This is why, when you consider buying flash, you need to test the latency – and not just at the storage level, but end-to-end via the application (I’ll talk about this more in a following post).

“But I Don’t Need That Many IOPS…”

This is classic misunderstanding, often the result of confusion brought about by FUD from storage vendors who cannot deliver at the higher end of the market. To repeat my previous statement, with a good flash system IOPS will effectively become an unlimited resource. This does not mean that it’s overkill for your needs. There is no point in spending more money on a solution than is necessary, but IOPS is not the indicator you should use to determine this – decisions like that should rely entirely on business requirements. I have yet to ever see a business requirement that related to IOPS (emphasis on business rather than technical).

Business requirements tend to be along the lines of needing to supply trading reports faster, or reduce the time spent by call centre operatives waiting for their CRM screens to refresh. These almost always translate back into latency requirements. After all, the key to solving any performance issue is always to follow the time and find out where it is being spent. Have you noticed that latency is the only one of our three fundamental characteristics which is expressed solely in units of time?

Don’t get distracted by IOPS… it’s all about latency.

The Role Of The DBA

burning-bridge

I’m back at work today after a week’s travelling around Europe followed by a week’s holiday sailing around the Ionian Sea. I have to say that I’d rather still be on holiday. It’s not that I don’t enjoy my job (I love it) but… Today, I need to install some database software – and it appears that in the last two weeks I forgot what a royal pain in the backside this process is. Either that or I left my brain in Greece…

It seems to me that the role of the DBA is to provide a bridge between the expectation and reality of database software. On the one side we have the marketing hype from the vendor promising an ideal scenario in which stuff just works (hey it’s “unbreakable!”), while on the other side is a set of business requirements defining what needs to be in place. The two seem to fit, yet in between is a yawning chasm – at the bottom of which lies a bubbling and hissing pool of error messages, patching requirements and workarounds; a lake of fire and confusion. The DBA is supposed to make this mess disappear, or at least shield the users from it, but the truth is that the gap feels like it’s getting wider. Some users are going to fall in, while others are blessedly ignorant of just how frail their support structure actually is.

There Is An Alternative…

Ok enough of the metaphors, time to offer some sort of solution. I propose that we automate some of the more mundane tasks of the DBA. Oh I know that some database vendors think they’ve already done this with their installation wizards and “one command” solutions, but we all know that these regularly fall over unless every single thing is *exactly* in the right place and the wind is blowing in the right direction.

No, I’m talking about automating the role of the DBA – the person who has to manually run the automation scripts. Yes, automate the automation. And I’ve begun already, by writing a script to perform a generic database software install. Ok so it’s only in pseudo-code so far, but it’s open sources so perhaps one of you clever people out there could build on it and credit me in the header?

So here we go. I present to you version 0.1 of the AutomaDBA solution’s Database Installation subroutine:

# Subroutine for handling installation of database software on a new host
# Part of class defining the role of the Database Administrator (DBA)

declare

	NUMBER_OF_ATTEMPTS := 0;

begin

	let NUMBER_OF_ATTEMPTS := NUMBER_OF_ATTEMPTS + 1;

	if NUMBER_OF_ATTEMPTS >= 2 then prepare_host();

	let ERRORS := install_database_software(PRODUCT, VERSION);

	while ERRORS > 0; loop

		# Check error message on Support Portal
		if (check_errors_on_metalink == FOUND) then

			case SOLUTION in
				"WORKAROUND")
					implement_workaround();
					;;
				"PATCH"
					apply_patch(PATCH_NUMBER);
					;;
			end case;

		# Check error message on Google
		else if (check_errors_on_google == FOUND) then

			case SOLUTION in
				"WORKAROUND")
					implement_workaround();
					;;
				"PATCH"
					apply_patch(PATCH_NUMBER);
					;;
			end case;

		# Ask anyone and everyone if they know the answer
		else if (ask_other_people_for_help == SENSIBLE_ANSWER) then

			attempt_desperate_solution(SUGGESTION);

		else

			report "Failed to install"||PRODUCT||" "||VERSION;

			# Start again or give up?
			if NUMBER_OF_ATTEMPTS < PATIENCE_THRESHOLD then

				deinstall_database_software(PRODUCT, VERSION);
				retry_install;

			else

				exit INSTALL_FAILED;
			end if;

		end if;

	end loop;

#	document_successful_installation(PRODUCT, VERSION);  -- REMOVED DUE TO TIME CONSTRAINTS

	exit INSTALL_SUCCEEDED;

exception

	when others then
		prepare_resume;
end;

SLOB2: Testing The Effect Of Oracle Blocksize

I recently posted a test harness for generating physical I/O using the new version of SLOB (the Silly Little Oracle Benchmark) known as SLOBv2. This test harness can be used for driving varying workloads and then processing the results for use in … well, wherever really. Some friends of mine are getting very adept with R recently, but I have yet to board that train, so I’m still plugging my data into Excel. Here’s an example.

We know that Oracle allows varying database block sizes with the parameter DB_BLOCK_SIZE, which typically has values of 4k, 8k (the default), 16k or 32k. Do you ever change this value? In my experience the vast majority of customers use 8k and a small number of data warehouse users choose 32k. I almost never see 16k and absolutely never see 4k or lower. Yet the choice of value can have a big effect on performance…

Simple Test with 8k Block Size

In the storage world we like to talk about IOPS and throughput as well as latency (see this article for a description of these terms). IOPS and throughput are related: multiply the number of IOPS by the block size and you get the throughput as a result.

So let’s see what happens if we run SLOB PIO tests using the test harness for the default 8k block size, testing workloads with 0% update DML, 10%, 20% and 30%:

SLOB2-initial-testing

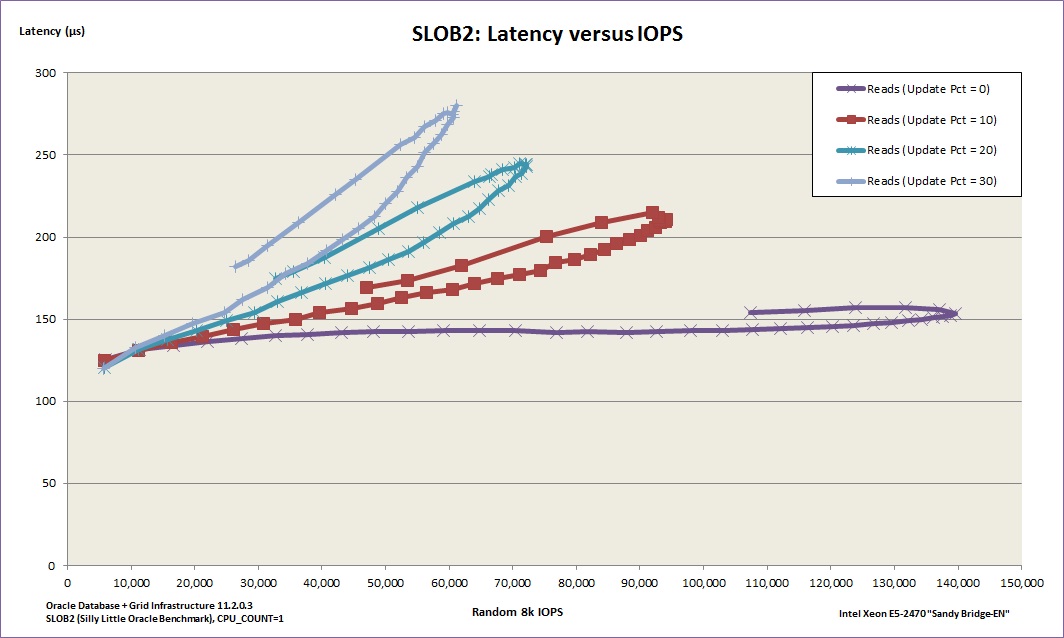
You can see four loops or “petals”, with each loop starting at the bottom left and working out towards the upper right, moving anti-clockwise before coming back down. This is expected behaviour, because each line tracks an increasing number of SLOB processes from 1 to 64. As the number of processes increases, so does the number of IOPS – and as a result there is a small increase in the latency. At some point near the high end of 64 the server CPU gets saturated, causing the number of IOPS to drop and therefore resulting in the latency coming down again – this is because the compute resource is exhausted while the storage has plenty left to spare (the server has 2 sockets each with an E5-2470 8-core processor, but crucially I am pinning* Oracle to one core with CPU_COUNT=1). To put that even more simply, there is not enough CPU available to drive the storage any harder (and the storage can go a LOT faster – after all, it’s the same storage used during this). [* This is really bad wording from me – see the comments section below]

From this graph we can deduce the optimum number of SLOB processes needed to drive the maximum possible I/O through Oracle for each workload: the point where the line bends back on itself marks this spot. We can also see, in graphical form, evidence of what we already know: read-only workloads can drive much higher amounts of IOPS at a lower latency than mixed workloads.

Multiple Tests with Varying Block Sizes

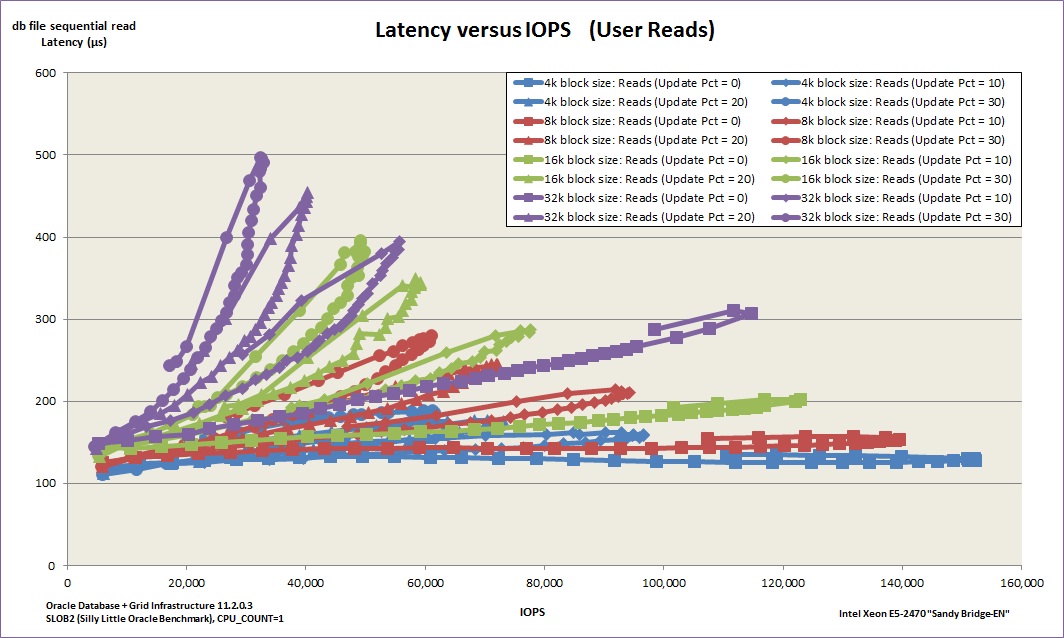
Now let’s take that relatively simple graph and cover it in cluttered “petal-shaped” lines like the ones above, but with a set for each of the following block sizes: 4k, 8k, 16k and 32k.

slob-blocksize-tests-latency-versus-IOPS

Ok so it’s not easy on the eyes – but look closely because there’s a story in there. In this graph, each block size has the same four-petal pattern as above, with the colour used to denote the block size. The 32k block size, for example, is in purple – and quite clearly exhibits the highest latencies at its peaks. The blue 4k blocksize line, on the other hand, has very low latencies and extends the furthest to the right – indicating that 4k would be the better choice if you were aiming to drive as many IOPS as possible.

So 4k has lower latency and more IOPS… must be the way to go, right?

Two Sides To Every Story

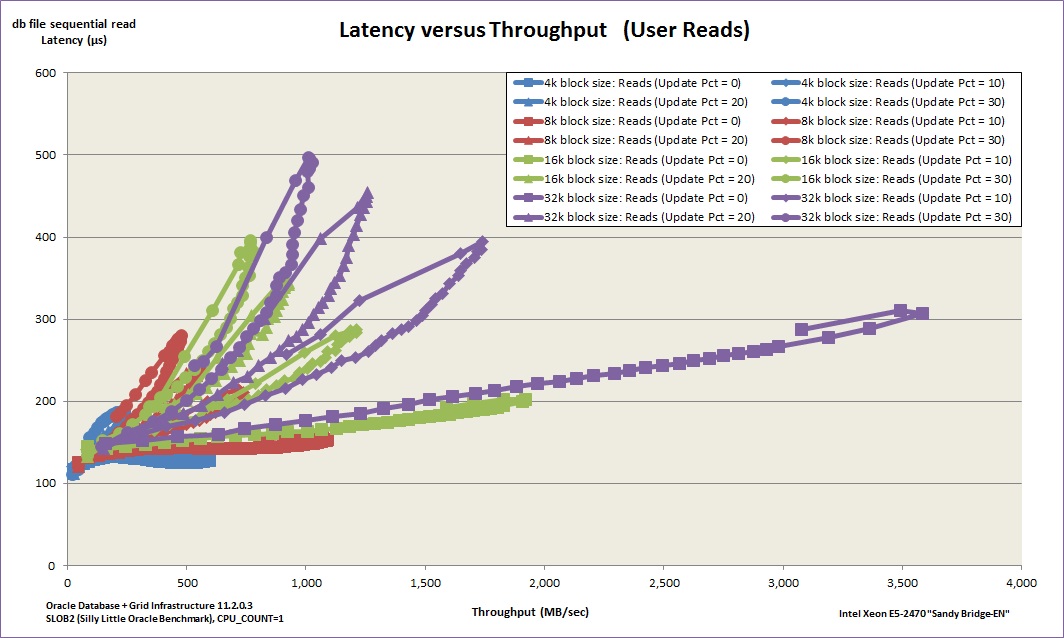
What happens if we stop thinking about IOPS and start thinking about throughput? By multiplying the IOPS by the block size we can draw up the same graph but with throughput on the horizontal axis instead:

slob-blocksize-tests-latency-versus-throughput

Well now. The blue 4k line may indeed have the lowest latency figures but if throughput is important it’s nowhere on this scale. The purple 32k line, on the other hand, is able to drive over 3,500MB/sec of throughput at its peak (and still stay around the 300 microsecond latency mark). Maybe 32k is the way to go then?

Conclusion

As always, the truth lies somewhere in between. In the case of SLOB the workload is extremely random, meaning that each update is probably only affecting one row per block. It therefore makes no sense to have large 32k blocks as this is just an overhead – the throughput may be high, but the majority of the data being read is waste. Your real life workload, on the other hand, is likely to be more diverse and unpredictable. SLOB is a brilliant tool for using Oracle itself to generate load, but not intended as a substitute for proper testing. What it is great for though is learning, so use the test harness (or write your own) and get testing.

Also, don’t overlook the impact of DB_BLOCK_SIZE when building your databases – as you can see above it has a potentially dramatic effect on I/O.

New SLOB2 Physical I/O Harness

slob ghostShort post to point out that I’ve now posted the updated PIO Test Harness for SLOB2. This can be used to run multiple SLOB tests with varying numbers of workers and values of UPDATE_PCT. In addition there is also a revised version of the AWR analyzer shell script which can be used to extract various performance values from the AWR reports outputted by SLOB2.

Having said that, SLOB2 also comes with its own data extraction tool, awr_info.sh, so it may be that you prefer to use this depending on what data you are interested in.

SLOB: PL/SQL Commit Optimization

slob ghostI ran some SLOB tests over the weekend using the new SLOBv2 kit and noticed some interesting results. I was using SLOB to generate physical I/O but the “anomaly” is best demonstrated by putting SLOB in “Logical I/O mode”, i.e. by having a large enough buffer cache to satisfy all reads.

I’m calling SLOB with the following configuration parameters and 32 worker processes:

UPDATE_PCT=20
RUN_TIME=30000
WORK_LOOP=1000
SCALE=10000
WORK_UNIT=256
REDO_STRESS=HEAVY
LOAD_PARALLEL_DEGREE=8
SHARED_DATA_MODULUS=0

Notice the WORK_LOOP value is non-zero and the RUN_TIME is fairly large – I’m choosing to run a specific set of SLOBops rather than use elapsed time to define each test length. With WORK_LOOP at 1,000 and 32 worker processes that should generate 32,000 SLOBops. Since UPDATE_PCT is 20% I would expect to see around (32,000 * 20%) = 6,400 update statements. So let’s have a look at a couple of interesting statistics in the AWR report generated from this run:

Statistic                                     Total     per Second     per Trans
-------------------------------- ------------------ -------------- -------------
redo synch writes                                97            2.0           0.0
user commits                                  6,400          134.5           1.0

That’s exactly the number of user commits we expected. But the number of redo synch writes is interesting…

Redo Synch Writes

When a session places a commit record into the log buffer it posts the log writer process and then puts itself into a log file sync wait until LGWR notifies it that the record has been written to persistent storage. Actually there are times when the session will not post LGWR (because it can see via a flag that LGWR is already writing) but one thing it always does is increment the counter redo synch writes. So in the above AWR output we would expect to see a matching number of redo synch writes to user commits… yet we don’t. Why?

There’s a little-known optimization in Oracle PL/SQL which means that Oracle will not always wait for the log buffer flush to complete, but will instead carry on processing – effectively sacrificing the D (durability) of ACID compliance. This is best explained by Jonathan Lewis in Chapter 6 of his excellent book Oracle Core – if you haven’t read it, consider putting it at the top of your reading list.

Because SLOB’s engine is a PL/SQL block containing a WHILE … LOOP, Oracle decides that the concept of durability can be rather loosely defined to be at the level of the PL/SQL block rather than the transactions being created within it. According to Jonathan, one way of persuading Oracle not to use this optimization is to use a database link; so let’s modify the slob.sql update statement to include the use of a loopback database link and see if the number of redo synch writes now rises to around 6,400:

Statistic                                     Total     per Second     per Trans
-------------------------------- ------------------ -------------- -------------
redo synch writes                             6,564          302.3           0.5
user commits                                 12,811          590.0           1.0

Indeed it does… but now the number of user commits has doubled, presumably as the result of Oracle performing a two-phase commit (Oracle doesn’t know the loopback database link points to the same database so assumes the transactions are distributed).

Conclusion

I blogged this because I found it interesting, rather than because I had a point I was trying to prove. However, if there were to be any conclusions to this entry they would be the following:

  1. SLOB is a great tool for experimenting with the behaviour of Oracle under load
  2. Jonathan’s Oracle Core book is essential reading for anyone who wants to understand Oracle to a deeper level

It’s probably also worth keeping in mind that SLOB’s use of PL/SQL blocks may result in slightly different behaviour from the log writer than you might see from alternative load generation tools or applications which generate I/O.

SLOB2: Essential for Every DBA Toolkit

slob ghostA couple of weeks ago, Kevin released the second version of SLOB – the Silly Little Oracle Benchmark. Readers will know that I was already a big fan of the original version, but version 2 (which I was fortunate enough to test prior to its release) now has extra features and functionality which make it the definitive load generation tool for Oracle databases. To put it simply, every DBA should now have SLOB2 in their toolkit.

Why? Well, SLOB allows you to learn things. It allows you to study performance and test the effect of changes that you introduce to a stable system. It allows you to find bottlenecks. And most importantly for me, it allows you to write test harnesses which build up a picture of the complete performance characteristics of a system.

Here’s an example using my two-socket eight-core Sandy Bridge-EN server. What’s the maximum number of IOPS I can drive through an Oracle database when running a read-only workload? What about a workload with 10% writes, or 20% or 30%? And what latencies does the storage deliver? Using SLOB2 with my PIO test harness (located here) I can easily generate all of these results and plot them on a graph:

SLOB2-initial-testing

Each line on the graph represents a SLOB test with a specific UPDATE_PCT value (0%, 10%, 20% or 30%). The line plots the IOPS vs Latency results as the number of SLOB worker processes ramps up from 1 to 64. You can see that, as you might expect, each line reaches a peak value of IOPS which the system can deliver (limited in this case by the server, not the storage) then starts to fall back down. From this graph you can fairly easily predict the behaviour as the UPDATE_PCT values increase further. Sometimes a picture really is worth a thousand words.

I’ll be posting some more SLOB test results and ideas soon. For now, my recommendation is to download it and use it. SLOB isn’t just a benchmark tool, it’s a learning tool. Use it wisely and you will come to understand a lot more about Oracle performance.

The Most Important Thing You Need To Know About Flash

NAND-flash

Storage for DBAs: There are many things you need to know about flash: it’s performance, it’s behaviour, it’s durability etc. But there’s one single piece of information which tells you more than anything else, because it gives you an insight into the future of not just flash memory, but the primary data storage industry. Let me explain, but first let me contrast against something we all more familiar with: disk drives.

Disk Drive Market History

Almost all disk drives are made by three manufacturers: Western Digital, Seagate and Toshiba. There used to be a lot more than that, but all the others either went out of business or got acquired. These are tough times for disk drive manufacturers, with sales expected to take a double-digit dive in 2013. It was not always this way though; for decades the thirst for HDDs was unquenchable, with large volumes of them being required in desktop PCs (remember them?) as well as enterprise disk arrays. Fast forward to the present day and desktop PCs have been ambushed by tablets and SSDs, while flash is now similarly disrupting the data centre.

For a minute though, let’s remember the golden era of disk. If we rewind around eight years ago, the disk industry was thriving. To quote a TrendFocus report published in Businesswire (emphasis added by me):

The industry’s 25% unit growth in 2005 was based on solid fundamentals in core markets like PCs and servers… Booming notebook PC sales caused a surge in 2.5″ HDD shipments to 77 million, a 45% growth. Enterprise HDD shipments grew 11% to over 26 million units. HDD industry revenue was $28 billion, an increase of 18% from 2004.

An 18% annual increase… that’s impressive! As the quote states, this growth was built on the “solid fundamentals” of PCs and Servers – nobody foresaw the end of the PC disk market,2013 HDD Market by Application because a new and exciting range of “Notebook PCs” seemed ready to drive demand even higher. And on top of that, two new market segments were growing rapidly: Consumer Electronics and Mobile. The graph on the left was created in 2005 and showed HDD market predictions going forward until 2010. The yellow and light blue colours indicate CE and Mobile respectively – you can see that there was a lot of optimism for the future – while the reddish colour indicates the huge returns from desktop PCs (while the Enterprise segment is merely a small purple brick at the bottom of each column). But somewhere at the bottom of a 2005 Q4 report published later that year were the first indications of a changing tide:

Shipments accounted for slightly less than the 20 percent forecast, and the drop-off is attributed to Apple’s decision to move away from 1-inch-based hard drives for its iPod mini business.

What did Apple move to? Take a guess. Very slowly, but very surely, the potential CE and Mobile markets evaporated. At the same time, the Desktop PC business died a lingering death, leaving enterprise storage as the mainstay for hard drives.

That’s one thing which remained constant through this period though: the enterprise HDD market. Enterprise Storage vendors like EMC and NetApp bought up massive volumes of disk drives to put in enterprise class arrays for their customers – and these massive volumes meant two critical outcomes:

  1. The larger Enterprise Storage vendors bought at enormous discounts
  2. HDD vendors selling to Enterprise Storage focussed their R&D efforts on improving the characteristics that these customers desired

The characteristics required for enterprise storage were: density and performance. It’s a simple case of supply and demand. As with all business, the demand shapes the supply.

NAND Flash Market Forces

One thing that flash has in common with disk is the relatively small number of manufacturers. Note that I’m not talking about companies like Violin here, I’m talking about the flash chip manufacturers who own the fabs. In 2012 the NAND flash market consisted of Samsung (38%), Toshiba (28%) – the inventor of flash, Micron (14%) and Hynix (12%). But who was the largest buyer worldwide? Was it EMC? Netapp? IBM, HP or Dell?

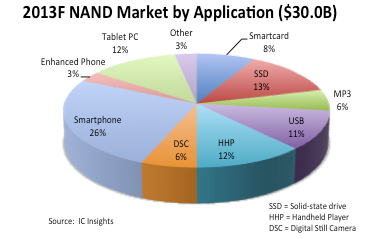
2013 NAND Market by ApplicationIn 2011, Apple became the largest worldwide consumer of NAND flash. And as I’m sure you can guess, the reason for this was the iPhone. Today, according to IC Insights, the majority of NAND flash (59%) is used in smartphones, tablets and portable devices, with another 17% used in USB keys and cameras. If you look at the pie chart on the right, that little red portion marked SSD (just 13%) comprises all the flash used in both enterprise storage and consumer solid state drives (e.g. the ones you might get in an ultrabook).

And that trend is only going one way. By the end of 2013 it is forecast that there will be nearly 1.5 billion smartphones in the world – one smartphone for every five people. Meanwhile, tablets are not only the fastest growing segments but also one of the fastest-growing consumer devices of all time.

What does this mean? It means that NAND flash development is driven by the consumer market, by smartphones and portable devices. In enterprise storage, when we talk about flash we always talk about performance and endurance – but the consumer market isn’t interested in either of these. The consumer market is interested in density, i.e. how much data you can fit on a chip, as well as power consumption and cost. If a NAND flash manufacturer could produce larger flash chips at the cost of 20% slower performance, for example, this would be considered a great result. There’s a fundamental difference in requirements between the consumer and enterprise markets: only the enterprise cares about performance.

The Balance Of Power

In the heyday of disk, the enterprise storage industry had serious influence on what came out of the factories. But with NAND flash, the power of the enterprise storage industry to influence the direction of development is clearly far weaker. Sure there are relationships between flash storage vendors and the manufacturers – in fact, one of the strongest is between Violin and Toshiba – but market forces dictate that NAND flash development will be mostly influenced by the consumer market: the phone in your pocket and the tablet on your desk. (Don’t be confused by claims of “enterprise-class” NAND flash either – the key is to follow where the billions of dollars of R&D money are going, i.e. the consumer market. Enterprise-class flash is merely the least-consumer-like consumer flash…)

cautionWhat does this mean for enterprise storage? It’s simple – it means that each enterprise vendor will have to take “consumer” flash and come up with innovative ways to make it perform like an enterprise product. Each flash vendor needs to do this to deliver the performance you need. Anybody can take a bunch of flash cards or SSDs and put them in a box, but that’s not innovation. The flash vendors who survive the great flash market consolidation will be the ones with intellectual property and patents around making consumer NAND flash perform for the enterprise.

Understand this and you will know the most important thing to ask a potential flash vendor about their product is not “How fast is it?”, or “How long does it last?”, but “Where’s your innovation?”. After all, if your vendor isn’t adding anything to the equation, you might as well be doing it yourself…

Does My Database Need Flash?

flash-and-the-disk-is-gone

Storage for DBAs: Here’s a question I get asked a lot: “Does my database need flash?”. In fact it’s the most common question customers have, followed by the alternative version, “Does my database need SSD?”. In fact, often customers already have some SSDs in their disk arrays but still see poor performance, so really I ought to wind it back a level and call this article, “Does my database need low latency storage?”. This would in fact be a much better headline from a technical perspective, but until I change the name of this site to LowLatencyDBA I’m sticking with the current title.

Flash is no longer a cutting edge new technology, it’s a mainstream product sold by almost every storage vendor. This means that you or your organisation will probably already have some flash sales person beating down your door to flog you some sort of flash product, whether it’s an all-flash array, a hybrid flash/disk system or a set of PCIe flash cards. While these products are diverse in nature, they all share two main characteristics: low latency and large numbers of IOPS. But how do you know whether you really need them?

In a later post I’ll be running through the questions which I think need to be asked in order to whittle down the massive list of flash vendors to the select few capable of servicing your needs. This, of course, will be difficult to achieve without being biased towards my own employer – but that’s a problem for another day. For now, here’s the first (and potentially most important) step: working out whether you actually need low latency flash storage in the first place.

Who Needs Flash?

For the world of databases, there are three main reasons why you might want to switch to low latency flash:

acceleration-consolidation-virtualizationAcceleration – perhaps the most obvious reason is to go faster. There are many reasons why people desire better performance, but they generally boil down to one of two scenarios: Not Good Enough Now and Not Good Enough For The Future. In the former, bad performance is holding back an application, denying potential revenue or incurring penalties in some way (either SLA-based financial penalties or simply the loss of customers due to poor service levels). In the latter, existing infrastructure is incapable of allowing increased agility, i.e. the ability to do more (offering new services for example, or adding more concurrent users).

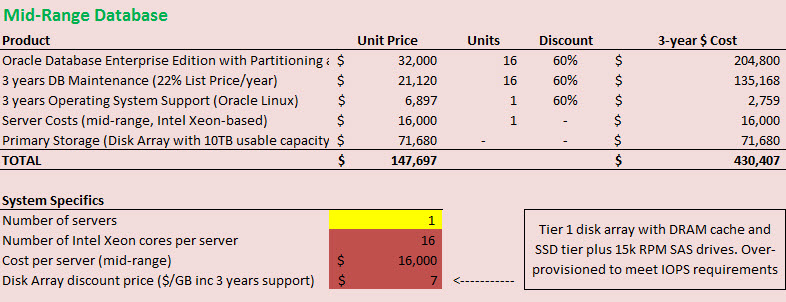
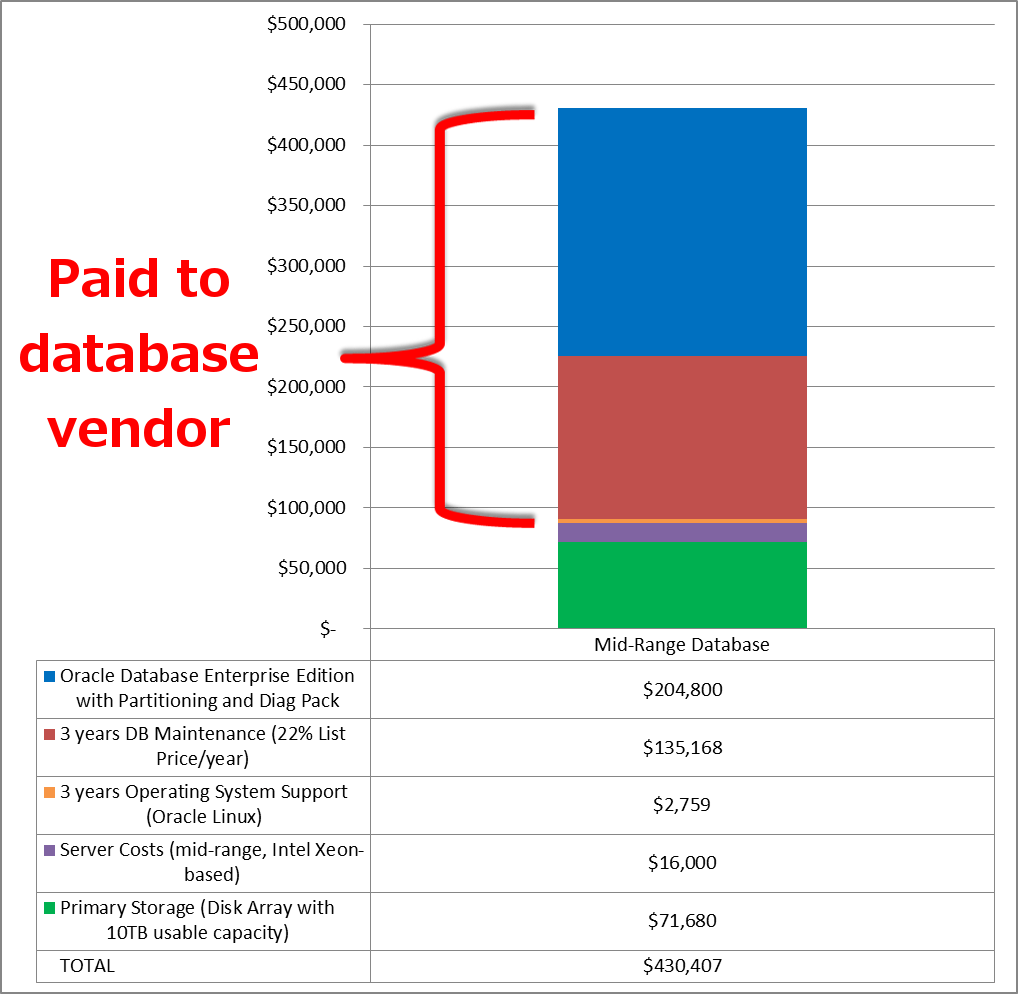
Consolidation – always on the mind of CIOs and CTOs is the benefit of consolidating database and server estates. Consolidation brings agility and risk benefits as well as the new and important benefit of cost savings. By consolidating (and standardising) multiple databases onto a smaller pool of servers, organisations save money on hardware, on maintenance and administration, and on the holy grail of all cost savings: software license fees. If you think that sounds like an exaggeration, take a look at this article on Wikibon which demonstrates that Oracle license costs account for 82% of the total cost of a traditional database deployment. Consolidation allows for reduced CPU cores, which means a reduction in the number of licenses, but it also increases I/O as workloads are “stacked” on the same infrastructure. The Wikibon article argues that by moving to flash storage and consolidating, the total cost drops significantly – by around 26% in fact.

Virtualisation – an increasingly prevalent option in the database world. The use of server virtualisation technologies is allowing organisations to move to cloud architectures, where environments are automatically provisioned, managed and migrated across hardware. Virtualisation brings massive agility benefits but also carries a risk because, just like with consolidation, I/O workloads accumulate on the same infrastructure. Unlike consolidation though, virtualisation adds an extra layer of latency, making the I/O even more of a potential bottleneck. Flash systems now make this option practical, as hypervisor vendors begin to realise the potential of flash memory.

There is actually a fourth reason, which is Infrastructure Optimisation. If you have data centres stuffed with disk arrays there is every chance that they can be replaced by a small number of flash arrays, thus reducing power, cooling and real estate requirements and saving large amounts of money. But as this article is primarily targeted at databases I thought I’d leave that one out for now. Consider it the icing on the cake… but don’t forget it, because sometimes it turns out that there’s a lot of icing.

So now we know the reasons why, let’s have a look at which sorts of systems are suitable for flash and which aren’t, starting with the Performance requirement…

Databases Love Flash If…

  • tickThey create lots of I/O! I know, it sounds obvious, but more than once I’ve seen customers with CPU-bound applications that generate hardly any I/O. Flash is a fantastic technology, but its not magic.
  • There is lots of random I/O. Now don’t take that the wrong way – sequential I/O is good too. But if you currently have a random I/O workload running on a disk system you will see the most dramatic benefit after switching that to flash. Here’s why.
  • High amounts of parallelism. The simple fact is that a single process cannot drive anywhere near the amount of I/O that a good flash system can support. If you think of flash as being like a highway, not only is it fast, it’s also wide. Use all the lanes.
  • Large IOWAIT times. If you are using an operating system that has a concept of IOWAIT (Linux and most versions of UNIX do, Windows doesn’t) then this can be a great indicator that processes are stuck waiting on I/O. It’s not perfect though, because IOWAIT is actually an idle wait (within the operating system, this is nothing to do with Oracle wait events) so if the system is really busy it may not be present.

Those are all great indicators, but the next two should be considered the golden rules:

  • I/O wait times are high. Essentially we are looking for high latency from the existing storage system. Flash memory systems should deliver I/O with sub-millisecond latency, so if you see an average latency of 8ms on random reads (db file sequential read), for example, you know there is potential for reducing latency to an eighth of its previous average value.
  • I/O forms a significant percentage of Database Time. If I/O is only responsible for 5% of database time, no amount of lightening-fast flash is going to give you a big performance boost… your problems are elsewhere. On the other hand, if I/O is comprising a large portion of database time, you have lots of room for improvement. (I plan to post a guide to reading AWR Reports pretty soon)

If any of this is ticking boxes for you, it’s time to consider what flash could do for the performance of your database. On the other hand…

Performance Won’t Improve If…

  • red-crossThere isn’t any I/O. Any flash vendor in the industry would be happy to sell you their products in this situation – and let’s face it you’ll get great latency! – but be realistic. If you don’t generate I/O, what’s the point? Unless of course you aren’t after performance. If consolidation, virtualisation or infrastructure optimisation is your aim, there could be a benefit. Also, consider the size of your memory components – if your database produces no physical I/O, could you consider reducing the size of the buffer cache? One of the big benefits of flash to consolidation is the ability to reduce SGA sizes and thus fit more databases onto the same DRAM-restricted server.
  • Single threaded workloads. Sure your application will run slightly faster, but will that speed-up be enough to justify the change of infrastructure? I’m not ruling this out – I have customers with single-threaded ETL jobs that bought flash because it was easier (and cheaper) than rewriting legacy code, but the impact of low-latency storage may well be reduced.
  • Application serialisation points. A session waiting on a lock will not wait any faster! Basically, if your application regularly ties itself in a knot with locks and contention issues, putting it on flash may well just increase the speed at which you hit those problems. Sometimes people use flash to overcome bad programming, but it’s by no means guaranteed to work.
  • CPU-bound systems. CPU starvation is a CPU problem, not an I/O problem. If anything, moving to low-latency storage will reduce the amount of time CPUs spent waiting on I/O and thus increase the amount of time they spend working, i.e. in a busy state. If your CPU is close to the limit and you remove the ballast that is a disk system, you might find that you hit the limit very quickly.

If you are unfortunate enough to be struggling with a badly-performing application that fits into one of these areas, flash probably isn’t the magic bullet you’re looking for.

Consolidation and Virtualisation

This is a different area where it’s no longer valid to only look at individual databases and their workloads. The key factor for both of these areas is density i.e. the number of databases or virtual machines that can fit on a single physical server. The main challenges here are memory usage and I/O generation: databases SGAs tend to be large, but flash allows for the possibility of reducing the buffer cache; while I/O generation is a problem in the disk world because consolidated workloads tend to create more random I/O. Of course, with flash that’s not really a problem. I’ve written a number of articles on consolidation and virtualisation in the past – I’m sure I’ll be writing more about them in the future too.

Summary

I work for a flash vendor – we want you to buy our products. We have competitors who want you to buy their products instead. If everyone in the industry is telling you to buy flash, how do you know if it’s relevant to you? Here’s my advice: make them speak your language and then check their claims against what you can see yourself.

Take some time to understand your workload. Look at the amount of I/O generated and the latency experienced; look at how random the workload is and the ratio of reads to writes (I’ll post a guide for this soon). Ask your (potential) flash vendor how much benefit you will see from your existing storage and then get them to explain why. If you’re a database person, make them speak in your language – don’t accept someone talking in the language of storage. Likewise if you’re an application person make them explain the benefits from an application perspective. You’re the customer, after all.

If your flash vendor can’t communicate with you in your language to explain the benefit you will see, there’s only one course of action: Get rid of them in a flash.

Footnote

Incidentally, if you live outside the UK and you’re wondering about the picture at the top of this article, check out this. If you live inside the UK you will know it’s a Cillit Bang reference… unless you live in a cave and shun the outside world – in which case, how are you reading this?

Understanding I/O: Random vs Sequential

sushiStorage for DBAs: Ever been to one of those sushi restaurants where the food comes round in dishes on a conveyor belt? As each dish travels around the loop you eye it up and, as long as you can make your mind up in time, grab it. However, if you are as indecisive as me, there’s a chance it will be out of range before you come to your senses – in which case you have to wait for it to complete a further full revolution before getting another chance. And that’s assuming someone else doesn’t get to it first.

Let’s assume that it takes a dish exactly 4 minutes to complete a whole lap of the conveyor belt. And just for simplicity’s sake let’s also assume that no two dishes on the belt are identical. As a hungry diner you look in the little menu and see a particular dish which you decide you want. It’s somewhere on the belt, so how long will it take to arrive?

Probability dictates that it could be anywhere on the belt. It could be passing by right now, requiring no wait time – or it could have just passed out of reach, thus requiring 4 minutes of wait time to go all the way round again. As you follow this random method (choose from the menu then look at the belt) it makes sense that the average wait time will tend towards half way between the min and max wait times, i.e. 2 minutes in this case. So every time you pick a dish you wait an average of 2 minutes: if you have eight dishes the odds say that you will spend (8 x 2) = 16 minutes waiting for your food. Welcome to the disk data diet, I hope you weren’t too hungry?

Now let’s consider an alternative option, where you order eight dishes from the chef and he or she places all of them sequentially (i.e. next to each other) somewhere on the conveyor belt. That location is random, so again you might have to wait anywhere between 0 and 4 minutes (an average of 2 minutes) for the first dish to pass… but the next seven will follow one after the other with no wait time. So now, in this scenario, you only had to wait 2 minutes for all eight dishes. Much better.

I’m sure you will have seen through my analogy right from the start. The conveyor belt is a hard disk and the sushi dishes are blocks which are being eaten / read. I haven’t yet worked out how to factor a bottle Asahi Super Dry into this story, but I’ll have one all the same thanks.

Random versus Sequential I/O

I have another article planned for later in this series which describes the inescapable mechanics of disk. For now though, I’ll outline the basics: every time you need to access a block on a disk drive, the disk actuator arm has to move the head to the correct track (the seek time), then the disk platter has to rotate to locate the correct sector (the rotational latency). This mechanical action takes time, just like the sushi travelling around the conveyor belt.

random-or-sequentialObviously the amount of time depends on where the head was previously located and how fortunate you are with the location of the sector on the platter: if it’s directly under the head you do not need to wait, but if it just passed the head you have to wait for a complete revolution. Even on the fastest 15k RPM disk that takes 4 milliseconds (15,000 rotations per minute = 250 rotations per second, which means one rotation is 1/250th of a second or 4ms). Admittedly that’s faster than the sushi in my earlier analogy, but the chances are you will need to read or write a far larger number of blocks than I can eat sushi dishes (and trust me, on a good day I can pack a fair few away).

What about the next block? Well, if that next block is somewhere else on the disk, you will need to incur the same penalties of seek time and rotational latency. We call this type of operation a random I/O. But if the next block happened to be located directly after the previous one on the same track, the disk head would encounter it immediately afterwards, incurring no wait time (i.e. no latency). This, of course, is a sequential I/O.

Size Matters

In my last post I described the Fundamental Characteristics of Storage: Latency, IOPS and Bandwidth (or Throughput). As a reminder, IOPS stands for I/Os Per Second and indicates the number of distinct Input/Output operations (i.e. reads or writes) that can take place within one second. You might use an IOPS figure to describe the amount of I/O created by a database, or you might use it when defining the maximum performance of a storage system. One is a real-world value and the other a theoretical maximum, but they both use the term IOPS.storage-characteristics

When describing volumes of data, things are slightly different. Bandwidth is usually used to describe the maximum theoretical limit of data transfer, while throughput is used to describe a real-world measurement. You might say that the bandwidth is the maximum possible throughput. Bandwidth and throughput figures are usually given in units of size over units of time, e.g. Mb/sec or GB/sec. It pays to look carefully at whether the unit is using bits (b) or bytes (B), otherwise you are likely to end up looking a bit silly (sadly, I speak from experience).

In the previous post we stated that IOPS and throughput were related by the following relationship:

Throughput   =   IOPS   x   I/O size

It’s time to start thinking about that I/O size now. If we read or write a single random block in one second then the number of IOPS is 1 and the I/O size is also 1 (I’m using a unit of “blocks” to keep things simple). The Throughput can therefore be calculated as (1 x 1) = 1 block / second.

Alternatively, if we wanted to read or write eight contiguous blocks from disk as a sequential operation then this again would only result in the number of IOPS being 1, but this time the I/O size is 8. The throughput is therefore calculated as (1 x 8) = 8 blocks / second.

Hopefully you can see from this example the great benefit of sequential I/O on disk systems: it allows increased throughput. Every time you increase the I/O size you get a corresponding increase in throughput, while the IOPS figure remains resolutely fixed. But what happens if you increase the number of IOPS?

Latency Kills Disk Performance

In the example above I described a single-threaded process reading or writing a single random block on a disk. That I/O results in a certain amount of latency, as described earlier on (the seek time and rotational latency). We know that the average rotational latency of a 15k RPM disk is 4ms, so let’s add another millisecond for the disk head seek time and call the average I/O latency 5ms. snailHow many (single-threaded) random IOPS can we perform if each operation incurs an average of 5ms wait? The answer is 1 second / 5 ms = 200 IOPS. Our process is hitting a physical limit of 200 IOPS on this disk.

What do you do if you need more IOPS? With a disk system you only really have one choice: add more disks. If each spindle can drive 200 IOPS and you require 80,000 IOPS then you need (80,000 / 200) = 400 spindles. Better clear some space in that data centre, eh?

On the other hand, if you can perform the I/O sequentially you may be able to reduce the IOPS requirement and increase the throughput, allowing the disk system to deliver more data. I know of Oracle customers who spend large amounts of time and resources carving up and re-ordering their data in order to allow queries to perform sequential I/O. They figure that the penalty incurred from all of this preparation is worth it in the long run, as subsequent queries perform better. That’s no surprise when the alternative was to add an extra wing to the data centre to house another bunch of disk arrays, plus more power and cooling to run them. This sort of “no pain, no gain” mentality used to be commonplace because there really weren’t any other options. Until now.

Flash Offers Another Way

The idea of sequential I/O doesn’t exist with flash memory, because there is no physical concept of blocks being adjacent or contiguous. Logically, two blocks may have consecutive block addresses, but this has no bearing on where the actual information is electronically stored. You might therefore say that all flash I/O is random, but in truth the principles of random I/O versus sequential I/O are disk concepts so don’t really apply. And since the latency of flash is sub-millisecond, it should be possible to see that, even for a single-threaded process, a much larger number of IOPS is possible. When we start considering concurrent operations things get even more interesting… but that topic is for another day.

sushi-dishBack to the sushi analogy, there is no longer a conveyor belt – the chefs are standing right in front of you. When you order a dish, it is placed in front of you immediately. Order a number of dishes and you might want to enlist the help of a few friends to eat in parallel, because the food will start arriving faster than you can eat it on your own. This is the world of flash memory, where hunger for data can be satisfied and appetites can be fulfilled. Time to break that disk diet, eh?

Looking back at the disk model, all that sitting around waiting for the sushi conveyor belt just takes too long. Sure you can add more conveyor belts or try to get all of your sushi dishes arranged in a line, but at the end of the day the underlying problem remains: it’s disk. And now that there’s an alternative, disk just seems a bit too fishy to me…

Strange ASM Behaviour with 4k Devices

question-mark-dice

This is only a short post to document something I’ve seen and reproduced but still don’t understand. Storage devices generally have a physical sector size of 512 bytes or, more recently, 4k. This is a subject which causes much confusion (partly because some vendors seek to portray whichever sector size they use as “better”). You can read more about the subject here.

On my Oracle Linux 6.3 server running the Unbreakable Enterprise Kernel I have two block devices presented from Violin. These devices have physical block sizes of 4k but logical block sizes of 512 bytes:

[root@server1 ~]# uname -r
2.6.39-200.24.1.el6uek.x86_64

[root@server1 ~]# fdisk -l /dev/mapper/violin_data1 | grep "Sector size"
Sector size (logical/physical): 512 bytes / 4096 bytes

[root@server1 ~]# fdisk -l /dev/mapper/violin_data2 | grep "Sector size"
Sector size (logical/physical): 512 bytes / 4096 bytes

Using Oracle Grid Infrastructure 11.2.0.3, I’m now going to create an ASM diskgroup on just one of the devices, using the new clause SECTOR_SIZE=4096:

SQL> CREATE DISKGROUP DATA EXTERNAL REDUNDANCY
  2  DISK '/dev/mapper/violin_data1'
  3  ATTRIBUTE
  4       'sector_size'='4096',
  5       'compatible.asm' = '11.2',
  6       'compatible.rdbms' = '11.2';

Diskgroup created.

SQL> select GROUP_NUMBER, DISK_NUMBER, STATE, NAME, PATH, SECTOR_SIZE from v$asm_disk;

GROUP_NUMBER DISK_NUMBER STATE    NAME            PATH                      SECTOR_SIZE
------------ ----------- -------- --------------- ------------------------- -----------
           0           1 NORMAL                   /dev/mapper/violin_data2          512
           1           0 NORMAL   DATA_0000       /dev/mapper/violin_data1          512

As you can see, the disk which joined the diskgroup shows a sector size of 512 (which is correct, because ASM is reading the logical block size of the device). The other disk is also showing a 512 byte sector size. So now let’s add it to the diskgroup:

SQL> alter diskgroup data add disk '/dev/mapper/violin_data2';

Diskgroup altered.

SQL> select GROUP_NUMBER, DISK_NUMBER, STATE, NAME, PATH, SECTOR_SIZE from v$asm_disk;

GROUP_NUMBER DISK_NUMBER STATE    NAME            PATH                      SECTOR_SIZE
------------ ----------- -------- --------------- ------------------------- -----------
           1           1 NORMAL   DATA_0001       /dev/mapper/violin_data2         4096
           1           0 NORMAL   DATA_0000       /dev/mapper/violin_data1          512

Huh? The newly added disk has suddenly become a 4k sector device. Why? If I add both devices during the initial CREATE DISKGROUP statement this does not happen, it only seems to happen when I ADD the disk to an existing diskgroup.

Why?